
Concept explainers
a)
To establish: Upper and lower control limits for the control chart and graph the data.
Introduction: Control charts used to determine whether the process is under control or not. Attributes and variables are the factors under the control charts.
a)
Answer to Problem 20P
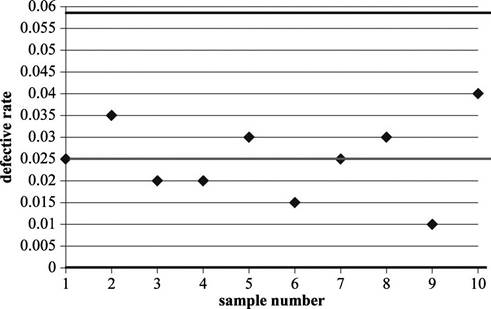
The upper control limit is 0.05812 and lower control limit is 0.
Explanation of Solution
Given information:
The following information is given:
| Sample | 1 | 2 | 3 | 4 | 5 | 6 | 7 | 8 | 9 | 10 |
| Defectives | 5 | 7 | 4 | 4 | 6 | 3 | 5 | 6 | 2 | 8 |
Compute the defective rate
Defective rate is calculated by dividing the sum of defectives and multiple of number of samples and sample size. Hence, the defective rate is 0.025.
Determine
Sample size is given as 200 and the defective rate is calculated as 0.025. Substitute the values in above equation. Hence, the standard deviation is 0.01104.
Determine UCL:
It can be calculated by adding the defective rate with the value attained by multiplying the number of standard deviation for setting the limit and standard deviation of the sampling distribution.
Hence, the UCL value is 0.05812.
Determine LCL:
It can be calculated by subtracting the defective rate with the value attained by multiplying the number of standard deviation for setting the limit and standard deviation of the sampling distribution.
Hence, the LCL value is 0.
Draw a p-chart for the attained values:
b)
To determine: Whether the process been in control.
Introduction: Control charts used to determine whether the process is under control or not. Attributes and variables are the factors under the control charts.
b)
Answer to Problem 20P
The process been in control.
Explanation of Solution
Given information:
The following information is given:
| Sample | 1 | 2 | 3 | 4 | 5 | 6 | 7 | 8 | 9 | 10 |
| Defectives | 5 | 7 | 4 | 4 | 6 | 3 | 5 | 6 | 2 | 8 |
Determine whether the process in control:
Since all the values are within the upper and lower control limits, the process seems to be in control.
The last two samples, sample number #9 and sample number #10 are showing a wider dispersion from the center line. Further samples need to be drawn and verified whether the defective rates increase in dispersion.
c)
To establish: Upper and lower control limits for the control chart and graph the data, if the sample size were 100.
Introduction: Control charts used to determine whether the process is under control or not. Attributes and variables are the factors under the control charts.
c)
Answer to Problem 20P
The upper control limit is 0.11537 and lower control limit is 0.
Explanation of Solution
Given information:
The following information is given:
| Sample | 1 | 2 | 3 | 4 | 5 | 6 | 7 | 8 | 9 | 10 |
| Defectives | 5 | 7 | 4 | 4 | 6 | 3 | 5 | 6 | 2 | 8 |
Compute the defective rate
Defective rate is calculated by dividing the sum of defectives and multiple of number of samples and sample size. Hence, the defective rate is 0.05.
Determine
Sample size is given as 100 and the defective rate is calculated as 0.05. Substitute the values in above equation. Hence, the standard deviation is 0.02179.
Determine UCL:
It can be calculated by adding the defective rate with the value attained by multiplying the number of standard deviation for setting the limit and standard deviation of the sampling distribution.
Hence, the UCL value is 0.11537.
Determine LCL:
It can be calculated by subtracting the defective rate with the value attained by multiplying the number of standard deviation for setting the limit and standard deviation of the sampling distribution.
Hence, the LCL value is 0.
Draw a p-chart for the attained values:
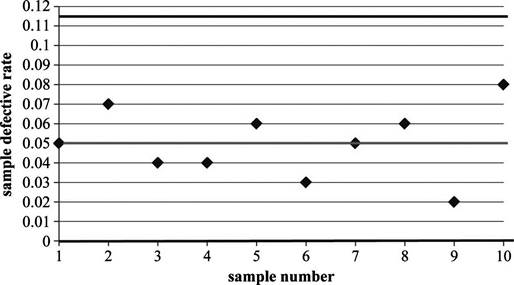
Since all the values are within the upper and lower control limits, the process seems to be in control. This is expected, as the observations were within the limits even when the limits were narrower.
Want to see more full solutions like this?
Chapter 6 Solutions
EBK PRINCIPLES OF OPERATIONS MANAGEMENT


- Checkout time at a supermarket is monitored using a mean and a range chart. Six samples of n = 20 observations have been obtained and the sample means and ranges computed: Sample Mean Range 1 3.06 .42 2 3.15 .50 3 3.11 .41 4 3.13 .46 5 3.06 .46 6 3.09 .45 Using the factors in Table 10.3 , determine upper and lower limits for mean and range charts. Is the process in control?arrow_forwardIn quality control, what does competency mean competence mean?arrow_forwardExplain what might cause a process to be out of control in managing quality ?arrow_forward
- x and R Control Charts A cereal manufacturer fills cereal boxes to an averageweight of 20 ounces and has an average range of 2 ounces when the filling process is in control. A sample size of 10 boxes is used in evaluating the process.a. What are the CL, UCL, and LCL for the x and R charts?b. A sample with the following 10 measurements was just taken: 20, 21, 19, 18, 19, 21,22, 20, 20, 19. Is the process still in control?arrow_forward10. To monitor the quality of pepperoni pizzas, a quality control manager collects random samples of pizzas and evaluates them. The process mean and standard deviation for the weight and diameter of pizzas are not known. Which of the following(s) is a correct matching between the type of data collected and the choice of control chart used? Select all correct matchings. Select one: a. The manager weighed the sampled pizzas and constructed a c-chart. b. The manager rated the appearance of sampled pizzas as acceptable or unacceptable and then constructed a c-chart. c. The manager counted the number of pepperonis per each inspected pizza and constructed a mean chart. d. The manager measured the diameter of the sampled pizzas and constructed a range chart.arrow_forwardWebster Chemical Company produces mastics and caulkingfor the construction industry. The product is blended inlarge mixers and then pumped into tubes and capped.Management is concerned about whether the filling processfor tubes of caulking is in statistical control. The processshould be centered on 8 ounces per tube. Several samplesof eight tubes were taken, each tube was weighed, and theweights in Table 3.3 were obtained. a. Assume that only six samples are sufficient and developthe control charts for the mean and the range.b. Plot the observations on the control chart and commenton your findings.arrow_forward
- For question 1 choose from the following: x bar-chart, c-chart, p-chart, or none of the about. 1. The process involving filling of a high value medicine into standard containers of 50 gms. 2. From a perspective of Statistical Process Control (SPC), a six-sigma process will have which of the following attributes? a) The USL and LSL will be separated by a distance of six sigma b) The process center will be aligned with the LSL c) The number of defects produced by the process will be 0.0018 parts per million d) All of the above 3. Which of the following statements depict the meaning of "total" in the term TQM? a) The total of all efforts put by the employees towards quality b) Total satisfaction of the customers about a company's products and services c) Ensuring every supplier follows quality practices in their work place d) Making quality happen everywhere in an organization by involving everyonearrow_forwardOur company has recently received a few customer complaints that its candles are not lasting the minimum 50 days previously advertised by the company. As the newly hired quality analyst you are planning to construct control charts that will give you a sense of the current status of the production process. To this end you have collected samples from 20 production batches. Use Microsoft Excel with answer based on both x̄-chart and R-chart plots -Is the candle production process in control? -What is your comment regarding the customer complaints? -Is there any scope of improvement? Use Microsoft Excel with answer based on both x̄-chart and R-chart plotsarrow_forwardAfter a number of complaints about its tech assistance, a computer manufacturer examined samples of calls to determine the frequency of wrong advice given to callers. Each sample consisted of 100 calls. Determine 95 percent limits. Is the tech assistance process stable (i.e., in control)? Explain.arrow_forward
- P-chart and c-chart. Using the appropriate control chart, determine two-sigma controllimits for each Problem case, a. An inspector found an average of 3.9 scratches in the exterior paint of each of theautomobiles being prepared for shipment to dealers. b. Before shipping lawnmowers to dealers, an inspector attempts to start each mowerand notes any that do not start on the first try. The lot size is 100 mowers, and anaverage of 4 did not start (4 percent).arrow_forwardIn your own words what is quality control, and define the 4 types of quality control: 1. Process control 2. Control charts 3. Product quality Control 4. Process Controlarrow_forwardAnalysis of the output of a process has suggested that the variability is nonrandom on several occasions recently. However, each time an investigation has not revealed any assignable causes. What are some of the possible explanations for not finding any causes? What should the manager do? And Use the dimensions of quality to describe typical characteristics of these products and services such as a. A television set. b. Eating a meal in a restaurantarrow_forward
 Practical Management ScienceOperations ManagementISBN:9781337406659Author:WINSTON, Wayne L.Publisher:Cengage,
 Operations ManagementOperations ManagementISBN:9781259667473Author:William J StevensonPublisher:McGraw-Hill Education
 Operations and Supply Chain Management (Mcgraw-hi...Operations ManagementISBN:9781259666100Author:F. Robert Jacobs, Richard B ChasePublisher:McGraw-Hill Education
 Purchasing and Supply Chain ManagementOperations ManagementISBN:9781285869681Author:Robert M. Monczka, Robert B. Handfield, Larry C. Giunipero, James L. PattersonPublisher:Cengage Learning
 Production and Operations Analysis, Seventh Editi...Operations ManagementISBN:9781478623069Author:Steven Nahmias, Tava Lennon OlsenPublisher:Waveland Press, Inc.