
Concept explainers
To develop: Appropriate control chart and determine whether there is any cause for concern in the cutting process.
Introduction: Control charts used to determine whether the process is under control or not. Attributes and variables are the factors under the control charts.
Explanation of Solution
Given information:
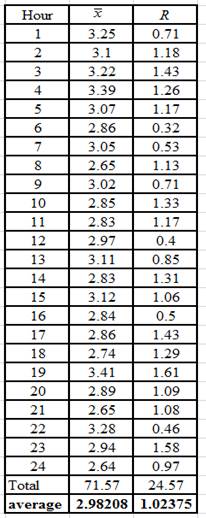
The following information is given:
Develop appropriate control chart:
To check whether the process is in control, create the appropriate control charts for the mean
Determine mean of the averages:
It can be calculated by taking the average of all given values for
Hence, the mean of averages
Determine mean of the ranges:
It can be calculated by taking the average of all given values for R.
Hence, the mean of ranges is
Determine the upper control limit and lower control limit of
Determine the upper control limit (UCL) and the lower control limit (LCL) of the
Here, the overall mean
Given the sample size of 4, the Mean factor is
Substitute into the equation (1),
Substitute into the equation (2),
Hence, the upper control limit is
Determine the upper control limit and lower control limit of
Determine the upper control limit (UCLR) and lower control limit (LCLR) of the
Here,
Given the sample size of 4 for
Substitute into the equation (3),
Similarly, substitute in equation (4),
Hence, the upper control limit is
Draw the control chart for the sample means:
The process mean is
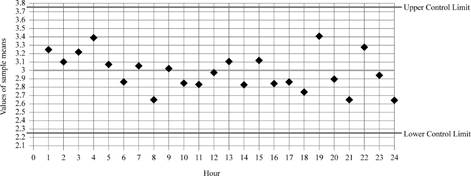
Observe that all the sample means are well within the control limits. The first five observations are above the mean of the averages.
Draw the control chart for the sample range:
The average range is
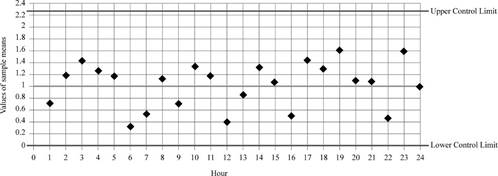
Observe that all the sample ranges are well within the control limits
Hence, the process seems to be in “statistical control”. (However, a process for making precision wires obviously should not have so much of variation in the mean or in the range.)
Want to see more full solutions like this?
Chapter 6 Solutions
EBK PRINCIPLES OF OPERATIONS MANAGEMENT


- Determine the upper and lower control limits for a mean chart, if you choose to use a sample size of 5. Set z=3arrow_forwardWhy is it important to prove that a process is proven capable before developing statistical control limits (i.e., SPC charts)?arrow_forwardExplain how to construct process control chart and use them to determine whether a process is out of statistical control?arrow_forward
- You are an analyst for a company that produces parts for medical devices, and these parts must meet specifications required by your customer. You implement a process improvement to decrease the variation in diameter for one of the parts, and want to determine if the process improvement had any effect. What type of control chart would be most appropriate to determine if the process improvement did in fact reduce variation in the output of the process? Group of answer choices a X-bar b R c P d C e Cpkarrow_forwardWhat does a run of 5 points above or below the centerline in a control chart imply?arrow_forwardMcDaniel Shipyards wants to develop control charts to assess the quality of its steel plate. They take ten sheets of 1" steel plate and compute the number of cosmetic flaws on each roll. Each sheet is 20' by 100'. Based on the following data, develop limits for the control chart, plot the control chart, and determine whether the process is in control. Sheet Number of flaws 1 1 2 1 3 2 4 0 5 1 6 5 7 0 8 2 9 0 10 2arrow_forward
- Average range for 4 samples is 0.4 ounce and the average mean of 5 observations is 19.8 ounces develop 3-sigma control limits?arrow_forwardE1 You manufacture a widget and use a C chart to monitor the number of defects associated with your process. Your sample size is constant and on average you find7 defects per sample. Identify the upper and lower control limits for the C chart.arrow_forwardThirty-five samples of size 7 each were taken from afertilizer-bag-filling machine. The results were overall mean =57.75 lb; average range = 1.78 lb.a) Determine the upper and lower control limits of the x -chart,where s = 3.b) Determine the upper and lower control limits of the R -chart,where s = 3.arrow_forward
- Explain what might cause a process to be out of control in managing quality ?arrow_forwardA process considered to be in control measures an ingredient in ounces. A quality inspector took 10 samples, each with 5 observations as follows: Using this information, obtain three-sigma (i.e., z=3) control limits for a mean control chart and control limits for a range chart, respectively. It is known from previous experience that the standard deviation of the process is 1.36. Discuss whether the process is in control or not.arrow_forwardA producer of windshields decides to monitor the material handling system used in the plant. The producer is concerned about if there are scratches that are appearing on their finished product. The best kind of control chart to use in this case is a: r chart b: x chart c: cpk chart d: P chartarrow_forward
 Practical Management ScienceOperations ManagementISBN:9781337406659Author:WINSTON, Wayne L.Publisher:Cengage,
 Operations ManagementOperations ManagementISBN:9781259667473Author:William J StevensonPublisher:McGraw-Hill Education
 Operations and Supply Chain Management (Mcgraw-hi...Operations ManagementISBN:9781259666100Author:F. Robert Jacobs, Richard B ChasePublisher:McGraw-Hill Education
 Purchasing and Supply Chain ManagementOperations ManagementISBN:9781285869681Author:Robert M. Monczka, Robert B. Handfield, Larry C. Giunipero, James L. PattersonPublisher:Cengage Learning
 Production and Operations Analysis, Seventh Editi...Operations ManagementISBN:9781478623069Author:Steven Nahmias, Tava Lennon OlsenPublisher:Waveland Press, Inc.