
Intro Stats + New Mylab Statistics With Pearson Etext:
5th Edition
ISBN: 9780134210230
Author: De Veaux, Richard D.
Publisher: Pearson College Div
expand_more
expand_more
format_list_bulleted
Concept explainers
Videos
Textbook Question
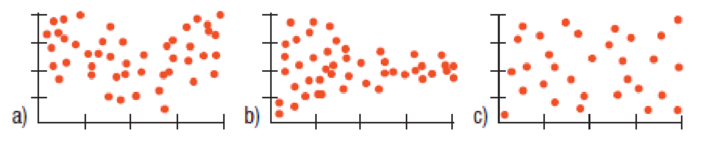
Chapter 7, Problem 28E
Residuals Tell what each of the residual plots below indicates about the appropriateness of the linear model that was fit to the data.
Expert Solution & Answer
Want to see the full answer?
Check out a sample textbook solution
Chapter 7 Solutions
Intro Stats + New Mylab Statistics With Pearson Etext:
Ch. 7.4 - A scatterplot of house Price (in dollars) vs....Ch. 7.4 - A scatterplot of house Price (in dollars) vs....Ch. 7.4 - A scatterplot of house Price (in dollars) vs....Ch. 7.4 - A scatterplot of house Price (in dollars) vs....Ch. 7.4 - A scatterplot of house Price (in dollars) vs....Ch. 7.4 - Prob. 6JCCh. 7.6 - Back to our regression of house Price () on house...Ch. 7.6 - Back to our regression of house Price () on house...Ch. 7.6 - Back to our regression of house Price () on house...Ch. 7 - True or false If false, explain briefly. a) We...
Ch. 7 - True or false II If false, explain briefly. a)...Ch. 7 - Prob. 3ECh. 7 - Prob. 4ECh. 7 - Bookstore sales revisited Recall the data we saw...Ch. 7 - Prob. 6ECh. 7 - Prob. 7ECh. 7 - Prob. 8ECh. 7 - Bookstore sales once more Here are the residuals...Ch. 7 - Prob. 10ECh. 7 - Prob. 11ECh. 7 - Prob. 12ECh. 7 - Prob. 13ECh. 7 - Prob. 14ECh. 7 - Prob. 15ECh. 7 - Prob. 16ECh. 7 - More cereal Exercise 15 describes a regression...Ch. 7 - Prob. 18ECh. 7 - Another bowl In Exercise 15, the regression model...Ch. 7 - More engine size In Exercise 16, the regression...Ch. 7 - Cereal again The correlation between a cereals...Ch. 7 - Prob. 22ECh. 7 - Prob. 23ECh. 7 - Prob. 24ECh. 7 - Prob. 25ECh. 7 - Prob. 26ECh. 7 - Prob. 27ECh. 7 - Residuals Tell what each of the residual plots...Ch. 7 - Real estate A random sample of records of home...Ch. 7 - Prob. 30ECh. 7 - Prob. 31ECh. 7 - Prob. 32ECh. 7 - Real estate again The regression of Price on Size...Ch. 7 - Prob. 34ECh. 7 - Prob. 35ECh. 7 - More misinterpretations A Sociology student...Ch. 7 - Real estate redux The regression of Price on Size...Ch. 7 - Prob. 38ECh. 7 - Prob. 39ECh. 7 - Prob. 40ECh. 7 - Prob. 41ECh. 7 - Last ride Consider the roller coasters (with the...Ch. 7 - Prob. 43ECh. 7 - Prob. 44ECh. 7 - Prob. 45ECh. 7 - Prob. 46ECh. 7 - Prob. 47ECh. 7 - Prob. 48ECh. 7 - Prob. 49ECh. 7 - Interest rates and mortgages 2015 again In Chapter...Ch. 7 - Online clothes An online clothing retailer keeps...Ch. 7 - Online clothes II For the online clothing retailer...Ch. 7 - Prob. 53ECh. 7 - Success in college Colleges use SAT scores in the...Ch. 7 - SAT, take 2 Suppose we wanted to use SAT math...Ch. 7 - Prob. 56ECh. 7 - Prob. 57ECh. 7 - Wildfires 2015sizes We saw in Exercise 57 that the...Ch. 7 - Used cars 2014 Carmax.com lists numerous Toyota...Ch. 7 - Drug abuse revisited Chapter 6, Exercise 42...Ch. 7 - Prob. 61ECh. 7 - Prob. 62ECh. 7 - Prob. 63ECh. 7 - Chicken Chicken sandwiches are often advertised as...Ch. 7 - Prob. 65ECh. 7 - Cost of living 2016 Numbeo.com lists the cost of...Ch. 7 - Prob. 67ECh. 7 - Prob. 68ECh. 7 - Prob. 69ECh. 7 - Climate change 2016, revisited In Exercise 69, we...Ch. 7 - Prob. 71ECh. 7 - Prob. 72ECh. 7 - Prob. 73ECh. 7 - Heptathlon revisited again We saw the data for the...Ch. 7 - Hard water In an investigation of environmental...Ch. 7 - Gators Wildlife researchers monitor many wildlife...Ch. 7 - Prob. 77ECh. 7 - Least squares Consider the four points (200,1950),...
Additional Math Textbook Solutions
Find more solutions based on key concepts
Four different beverages are sold at a fast-food restaurant: soft drinks, tea, coffee, and bottled water. a. Ex...
Basic Business Statistics, Student Value Edition
Teacher Salaries
The following data from several years ago represent salaries (in dollars) from a school distri...
Elementary Statistics: A Step By Step Approach
1. How is a sample related to a population?
Elementary Statistics: Picturing the World (6th Edition)
c
Solve.
70. Copy Center Account. Rachel’s copy-center bill for July was $327. She made a payment of $200 and t...
Developmental Mathematics (9th Edition)
10. Explain the steps in designing an experiment.
Fundamentals of Statistics (5th Edition)
Knowledge Booster


Learn more about
Need a deep-dive on the concept behind this application? Look no further. Learn more about this topic, statistics and related others by exploring similar questions and additional content below.Similar questions
- XYZ Corporation Stock Prices The following table shows the average stock price, in dollars, of XYZ Corporation in the given month. Month Stock price January 2011 43.71 February 2011 44.22 March 2011 44.44 April 2011 45.17 May 2011 45.97 a. Find the equation of the regression line. Round the regression coefficients to three decimal places. b. Plot the data points and the regression line. c. Explain in practical terms the meaning of the slope of the regression line. d. Based on the trend of the regression line, what do you predict the stock price to be in January 2012? January 2013?arrow_forwardDoes the following table represent a linear function ? If so, find the linear equation that models the data.arrow_forwardDraw a scatter plot for the data in Table 2. Then determine whether the data appears to belinearly related.arrow_forward
- Demand for Candy Bars In this problem you will determine a linear demand equation that describes the demand for candy bars in your class. Survey your classmates to determine what price they would be willing to pay for a candy bar. Your survey form might look like the sample to the left. a Make a table of the number of respondents who answered yes at each price level. b Make a scatter plot of your data. c Find and graph the regression line y=mp+b, which gives the number of respondents y who would buy a candy bar if the price were p cents. This is the demand equation. Why is the slope m negative? d What is the p-intercept of the demand equation? What does this intercept tell you about pricing candy bars? Would you buy a candy bar from the vending machine in the hallway if the price is as indicated. Price Yes or No 50 75 1.00 1.25 1.50 1.75 2.00arrow_forwardLife Expectancy The following table shows the average life expectancy, in years, of a child born in the given year42 Life expectancy 2005 77.6 2007 78.1 2009 78.5 2011 78.7 2013 78.8 a. Find the equation of the regression line, and explain the meaning of its slope. b. Plot the data points and the regression line. c. Explain in practical terms the meaning of the slope of the regression line. d. Based on the trend of the regression line, what do you predict as the life expectancy of a child born in 2019? e. Based on the trend of the regression line, what do you predict as the life expectancy of a child born in 1580?2300arrow_forwardHOW DO YOU SEE IT? Discuss how well a linear model approximates the data shown in each scatter plot.arrow_forward
arrow_back_ios
arrow_forward_ios
Recommended textbooks for you
 Glencoe Algebra 1, Student Edition, 9780079039897...AlgebraISBN:9780079039897Author:CarterPublisher:McGraw Hill

 Big Ideas Math A Bridge To Success Algebra 1: Stu...AlgebraISBN:9781680331141Author:HOUGHTON MIFFLIN HARCOURTPublisher:Houghton Mifflin Harcourt
 College AlgebraAlgebraISBN:9781305115545Author:James Stewart, Lothar Redlin, Saleem WatsonPublisher:Cengage Learning
 Algebra and Trigonometry (MindTap Course List)AlgebraISBN:9781305071742Author:James Stewart, Lothar Redlin, Saleem WatsonPublisher:Cengage Learning
Glencoe Algebra 1, Student Edition, 9780079039897...
Algebra
ISBN:9780079039897
Author:Carter
Publisher:McGraw Hill
Big Ideas Math A Bridge To Success Algebra 1: Stu...
Algebra
ISBN:9781680331141
Author:HOUGHTON MIFFLIN HARCOURT
Publisher:Houghton Mifflin Harcourt
College Algebra
Algebra
ISBN:9781305115545
Author:James Stewart, Lothar Redlin, Saleem Watson
Publisher:Cengage Learning
Algebra and Trigonometry (MindTap Course List)
Algebra
ISBN:9781305071742
Author:James Stewart, Lothar Redlin, Saleem Watson
Publisher:Cengage Learning
Correlation Vs Regression: Difference Between them with definition & Comparison Chart; Author: Key Differences;https://www.youtube.com/watch?v=Ou2QGSJVd0U;License: Standard YouTube License, CC-BY
Correlation and Regression: Concepts with Illustrative examples; Author: LEARN & APPLY : Lean and Six Sigma;https://www.youtube.com/watch?v=xTpHD5WLuoA;License: Standard YouTube License, CC-BY