
Intro Stats + New Mylab Statistics With Pearson Etext:
5th Edition
ISBN: 9780134210230
Author: De Veaux, Richard D.
Publisher: Pearson College Div
expand_more
expand_more
format_list_bulleted
Concept explainers
Videos
Textbook Question
Chapter 7, Problem 75E
Hard water In an investigation of environmental causes of disease, data were collected on the annual mortality rate (deaths per 100,000) for males in 61 large towns in England and Wales. In addition, the water hardness was recorded as the calcium concentration (parts per million, ppm) in the drinking water. The following display shows the relationship between Mortality and Calcium concentration for these towns:
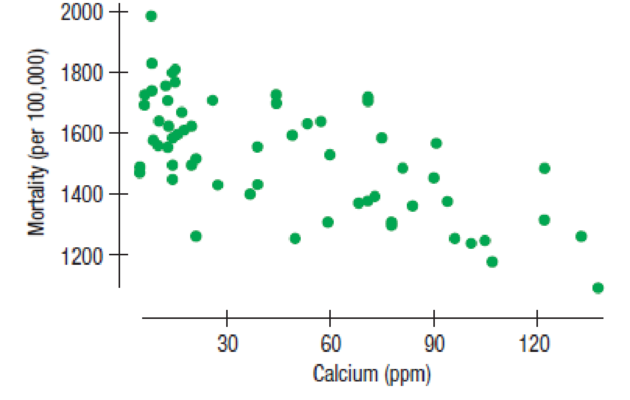
- a) Describe what you see in this
scatterplot , in context. - b) Here is the
regression analysis of Mortality and Calcium concentration. What is the regression equation?
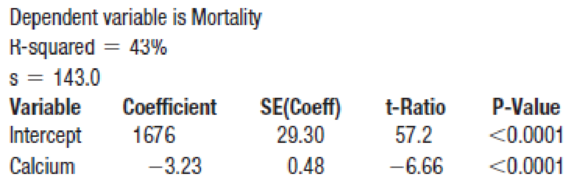
- c) Interpret the slope and intercept of the line, in context.
- d) The largest residual, with a value of –348.6, is for the town of Exeter. Explain what this value means.
- e) The hardness of Derby’s municipal water is about 100 ppm of calcium. Use this equation to predict the mortality rate in Derby.
- f) Explain the meaning of R-squared in this situation.
Expert Solution & Answer
Want to see the full answer?
Check out a sample textbook solution
Chapter 7 Solutions
Intro Stats + New Mylab Statistics With Pearson Etext:
Ch. 7.4 - A scatterplot of house Price (in dollars) vs....Ch. 7.4 - A scatterplot of house Price (in dollars) vs....Ch. 7.4 - A scatterplot of house Price (in dollars) vs....Ch. 7.4 - A scatterplot of house Price (in dollars) vs....Ch. 7.4 - A scatterplot of house Price (in dollars) vs....Ch. 7.4 - Prob. 6JCCh. 7.6 - Back to our regression of house Price () on house...Ch. 7.6 - Back to our regression of house Price () on house...Ch. 7.6 - Back to our regression of house Price () on house...Ch. 7 - True or false If false, explain briefly. a) We...
Ch. 7 - True or false II If false, explain briefly. a)...Ch. 7 - Prob. 3ECh. 7 - Prob. 4ECh. 7 - Bookstore sales revisited Recall the data we saw...Ch. 7 - Prob. 6ECh. 7 - Prob. 7ECh. 7 - Prob. 8ECh. 7 - Bookstore sales once more Here are the residuals...Ch. 7 - Prob. 10ECh. 7 - Prob. 11ECh. 7 - Prob. 12ECh. 7 - Prob. 13ECh. 7 - Prob. 14ECh. 7 - Prob. 15ECh. 7 - Prob. 16ECh. 7 - More cereal Exercise 15 describes a regression...Ch. 7 - Prob. 18ECh. 7 - Another bowl In Exercise 15, the regression model...Ch. 7 - More engine size In Exercise 16, the regression...Ch. 7 - Cereal again The correlation between a cereals...Ch. 7 - Prob. 22ECh. 7 - Prob. 23ECh. 7 - Prob. 24ECh. 7 - Prob. 25ECh. 7 - Prob. 26ECh. 7 - Prob. 27ECh. 7 - Residuals Tell what each of the residual plots...Ch. 7 - Real estate A random sample of records of home...Ch. 7 - Prob. 30ECh. 7 - Prob. 31ECh. 7 - Prob. 32ECh. 7 - Real estate again The regression of Price on Size...Ch. 7 - Prob. 34ECh. 7 - Prob. 35ECh. 7 - More misinterpretations A Sociology student...Ch. 7 - Real estate redux The regression of Price on Size...Ch. 7 - Prob. 38ECh. 7 - Prob. 39ECh. 7 - Prob. 40ECh. 7 - Prob. 41ECh. 7 - Last ride Consider the roller coasters (with the...Ch. 7 - Prob. 43ECh. 7 - Prob. 44ECh. 7 - Prob. 45ECh. 7 - Prob. 46ECh. 7 - Prob. 47ECh. 7 - Prob. 48ECh. 7 - Prob. 49ECh. 7 - Interest rates and mortgages 2015 again In Chapter...Ch. 7 - Online clothes An online clothing retailer keeps...Ch. 7 - Online clothes II For the online clothing retailer...Ch. 7 - Prob. 53ECh. 7 - Success in college Colleges use SAT scores in the...Ch. 7 - SAT, take 2 Suppose we wanted to use SAT math...Ch. 7 - Prob. 56ECh. 7 - Prob. 57ECh. 7 - Wildfires 2015sizes We saw in Exercise 57 that the...Ch. 7 - Used cars 2014 Carmax.com lists numerous Toyota...Ch. 7 - Drug abuse revisited Chapter 6, Exercise 42...Ch. 7 - Prob. 61ECh. 7 - Prob. 62ECh. 7 - Prob. 63ECh. 7 - Chicken Chicken sandwiches are often advertised as...Ch. 7 - Prob. 65ECh. 7 - Cost of living 2016 Numbeo.com lists the cost of...Ch. 7 - Prob. 67ECh. 7 - Prob. 68ECh. 7 - Prob. 69ECh. 7 - Climate change 2016, revisited In Exercise 69, we...Ch. 7 - Prob. 71ECh. 7 - Prob. 72ECh. 7 - Prob. 73ECh. 7 - Heptathlon revisited again We saw the data for the...Ch. 7 - Hard water In an investigation of environmental...Ch. 7 - Gators Wildlife researchers monitor many wildlife...Ch. 7 - Prob. 77ECh. 7 - Least squares Consider the four points (200,1950),...
Additional Math Textbook Solutions
Find more solutions based on key concepts
Refer to the Real Estate data, which reports information on homes sold in the Goodyear, Arizona, area during th...
Statistical Techniques in Business and Economics
Ten equally qualified marketing assistants are candidates for promotion to associate buyer; seven are men and t...
An Introduction to Mathematical Statistics and Its Applications (6th Edition)
A simple random sample of 200 third-graders in a large school district was chosen to participate in an after-sc...
Essential Statistics
1. How is a sample related to a population?
Elementary Statistics: Picturing the World (6th Edition)
AVX Home Entertainment, Inc., recently began a “no-hassles” return policy. A sample of 500 customers who recent...
EBK STATISTICAL TECHNIQUES IN BUSINESS
Knowledge Booster


Learn more about
Need a deep-dive on the concept behind this application? Look no further. Learn more about this topic, statistics and related others by exploring similar questions and additional content below.Recommended textbooks for you
 Glencoe Algebra 1, Student Edition, 9780079039897...AlgebraISBN:9780079039897Author:CarterPublisher:McGraw Hill
 Linear Algebra: A Modern IntroductionAlgebraISBN:9781285463247Author:David PoolePublisher:Cengage Learning
 Functions and Change: A Modeling Approach to Coll...AlgebraISBN:9781337111348Author:Bruce Crauder, Benny Evans, Alan NoellPublisher:Cengage Learning
 Big Ideas Math A Bridge To Success Algebra 1: Stu...AlgebraISBN:9781680331141Author:HOUGHTON MIFFLIN HARCOURTPublisher:Houghton Mifflin Harcourt
 Algebra & Trigonometry with Analytic GeometryAlgebraISBN:9781133382119Author:SwokowskiPublisher:Cengage
Glencoe Algebra 1, Student Edition, 9780079039897...
Algebra
ISBN:9780079039897
Author:Carter
Publisher:McGraw Hill
Linear Algebra: A Modern Introduction
Algebra
ISBN:9781285463247
Author:David Poole
Publisher:Cengage Learning
Functions and Change: A Modeling Approach to Coll...
Algebra
ISBN:9781337111348
Author:Bruce Crauder, Benny Evans, Alan Noell
Publisher:Cengage Learning
Big Ideas Math A Bridge To Success Algebra 1: Stu...
Algebra
ISBN:9781680331141
Author:HOUGHTON MIFFLIN HARCOURT
Publisher:Houghton Mifflin Harcourt
Algebra & Trigonometry with Analytic Geometry
Algebra
ISBN:9781133382119
Author:Swokowski
Publisher:Cengage
Correlation Vs Regression: Difference Between them with definition & Comparison Chart; Author: Key Differences;https://www.youtube.com/watch?v=Ou2QGSJVd0U;License: Standard YouTube License, CC-BY
Correlation and Regression: Concepts with Illustrative examples; Author: LEARN & APPLY : Lean and Six Sigma;https://www.youtube.com/watch?v=xTpHD5WLuoA;License: Standard YouTube License, CC-BY