
Intro Stats + New Mylab Statistics With Pearson Etext:
5th Edition
ISBN: 9780134210230
Author: De Veaux, Richard D.
Publisher: Pearson College Div
expand_more
expand_more
format_list_bulleted
Concept explainers
Videos
Textbook Question
Chapter 7, Problem 64E
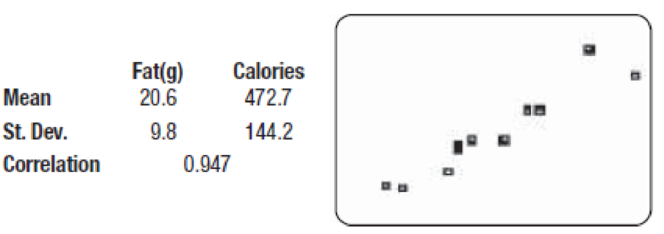
Chicken Chicken sandwiches are often advertised as a healthier alternative to beef because many are lower in fat. Tests on 11 brands of fast-food chicken sandwiches produced the following summary statistics and
- a) Do you think a linear model is appropriate in this situation?
- b) Describe the strength of this association.
- c) Write the equation of the regression line.
- d) Explain the meaning of the slope.
- e) Explain the meaning of the y-intercept.
- f) What does it mean if a certain sandwich has a negative residual?
- g) If a chicken sandwich and a burger each advertised 35 grams of fat, which would you expect to have more calories (see Exercise 63)?
Expert Solution & Answer
Want to see the full answer?
Check out a sample textbook solution
Students have asked these similar questions
Jensen Tire & Auto is deciding whether to purchase a maintenance contract for its newcomputer wheel alignment and balancing machine. Managers feel that maintenance expenseshould be related to usage, and they collected the following information on weeklyusage (hours) and annual maintenance expense (in hundreds of dollars).
a. Develop a scatter chart with weekly usage hours as the independent variable. Whatdoes the scatter chart indicate about the relationship between weekly usage and annualmaintenance expense?b. Use the data to develop an estimated regression equation that could be used to predictthe annual maintenance expense for a given number of hours of weekly usage. Whatis the estimated regression model?
c. Test whether each of the regression parameters b0 and b1 is equal to zero at a 0.05level of significance. What are the correct interpretations of the estimated regressionparameters? Are these interpretations reasonable?d. How much of the variation in the sample values of…
Chapter 7 Solutions
Intro Stats + New Mylab Statistics With Pearson Etext:
Ch. 7.4 - A scatterplot of house Price (in dollars) vs....Ch. 7.4 - A scatterplot of house Price (in dollars) vs....Ch. 7.4 - A scatterplot of house Price (in dollars) vs....Ch. 7.4 - A scatterplot of house Price (in dollars) vs....Ch. 7.4 - A scatterplot of house Price (in dollars) vs....Ch. 7.4 - Prob. 6JCCh. 7.6 - Back to our regression of house Price () on house...Ch. 7.6 - Back to our regression of house Price () on house...Ch. 7.6 - Back to our regression of house Price () on house...Ch. 7 - True or false If false, explain briefly. a) We...
Ch. 7 - True or false II If false, explain briefly. a)...Ch. 7 - Prob. 3ECh. 7 - Prob. 4ECh. 7 - Bookstore sales revisited Recall the data we saw...Ch. 7 - Prob. 6ECh. 7 - Prob. 7ECh. 7 - Prob. 8ECh. 7 - Bookstore sales once more Here are the residuals...Ch. 7 - Prob. 10ECh. 7 - Prob. 11ECh. 7 - Prob. 12ECh. 7 - Prob. 13ECh. 7 - Prob. 14ECh. 7 - Prob. 15ECh. 7 - Prob. 16ECh. 7 - More cereal Exercise 15 describes a regression...Ch. 7 - Prob. 18ECh. 7 - Another bowl In Exercise 15, the regression model...Ch. 7 - More engine size In Exercise 16, the regression...Ch. 7 - Cereal again The correlation between a cereals...Ch. 7 - Prob. 22ECh. 7 - Prob. 23ECh. 7 - Prob. 24ECh. 7 - Prob. 25ECh. 7 - Prob. 26ECh. 7 - Prob. 27ECh. 7 - Residuals Tell what each of the residual plots...Ch. 7 - Real estate A random sample of records of home...Ch. 7 - Prob. 30ECh. 7 - Prob. 31ECh. 7 - Prob. 32ECh. 7 - Real estate again The regression of Price on Size...Ch. 7 - Prob. 34ECh. 7 - Prob. 35ECh. 7 - More misinterpretations A Sociology student...Ch. 7 - Real estate redux The regression of Price on Size...Ch. 7 - Prob. 38ECh. 7 - Prob. 39ECh. 7 - Prob. 40ECh. 7 - Prob. 41ECh. 7 - Last ride Consider the roller coasters (with the...Ch. 7 - Prob. 43ECh. 7 - Prob. 44ECh. 7 - Prob. 45ECh. 7 - Prob. 46ECh. 7 - Prob. 47ECh. 7 - Prob. 48ECh. 7 - Prob. 49ECh. 7 - Interest rates and mortgages 2015 again In Chapter...Ch. 7 - Online clothes An online clothing retailer keeps...Ch. 7 - Online clothes II For the online clothing retailer...Ch. 7 - Prob. 53ECh. 7 - Success in college Colleges use SAT scores in the...Ch. 7 - SAT, take 2 Suppose we wanted to use SAT math...Ch. 7 - Prob. 56ECh. 7 - Prob. 57ECh. 7 - Wildfires 2015sizes We saw in Exercise 57 that the...Ch. 7 - Used cars 2014 Carmax.com lists numerous Toyota...Ch. 7 - Drug abuse revisited Chapter 6, Exercise 42...Ch. 7 - Prob. 61ECh. 7 - Prob. 62ECh. 7 - Prob. 63ECh. 7 - Chicken Chicken sandwiches are often advertised as...Ch. 7 - Prob. 65ECh. 7 - Cost of living 2016 Numbeo.com lists the cost of...Ch. 7 - Prob. 67ECh. 7 - Prob. 68ECh. 7 - Prob. 69ECh. 7 - Climate change 2016, revisited In Exercise 69, we...Ch. 7 - Prob. 71ECh. 7 - Prob. 72ECh. 7 - Prob. 73ECh. 7 - Heptathlon revisited again We saw the data for the...Ch. 7 - Hard water In an investigation of environmental...Ch. 7 - Gators Wildlife researchers monitor many wildlife...Ch. 7 - Prob. 77ECh. 7 - Least squares Consider the four points (200,1950),...
Knowledge Booster


Learn more about
Need a deep-dive on the concept behind this application? Look no further. Learn more about this topic, statistics and related others by exploring similar questions and additional content below.Similar questions
- The ordered pairs below give the median sales prices y (in thousands of dollars) of new homes sold in a neighborhood from 2009 through 2016. (2009, 179.4) (2011, 191.0) (2013, 202.6) (2015, 214.9) (2010, 185.4) (2012, 196.7) (2014, 208.7) (2016, 221.4) A linear model that approximates the data is y=5.96t+125.5,9t16, where t represents the year, with t=9 corresponding to 2009. Plot the actual data and the model on the same graph. How closely does the model represent the data?arrow_forwardLife Expectancy The following table shows the average life expectancy, in years, of a child born in the given year42 Life expectancy 2005 77.6 2007 78.1 2009 78.5 2011 78.7 2013 78.8 a. Find the equation of the regression line, and explain the meaning of its slope. b. Plot the data points and the regression line. c. Explain in practical terms the meaning of the slope of the regression line. d. Based on the trend of the regression line, what do you predict as the life expectancy of a child born in 2019? e. Based on the trend of the regression line, what do you predict as the life expectancy of a child born in 1580?2300arrow_forward
Recommended textbooks for you
 Functions and Change: A Modeling Approach to Coll...AlgebraISBN:9781337111348Author:Bruce Crauder, Benny Evans, Alan NoellPublisher:Cengage Learning
 Algebra & Trigonometry with Analytic GeometryAlgebraISBN:9781133382119Author:SwokowskiPublisher:Cengage
 Glencoe Algebra 1, Student Edition, 9780079039897...AlgebraISBN:9780079039897Author:CarterPublisher:McGraw Hill
 Big Ideas Math A Bridge To Success Algebra 1: Stu...AlgebraISBN:9781680331141Author:HOUGHTON MIFFLIN HARCOURTPublisher:Houghton Mifflin Harcourt
Functions and Change: A Modeling Approach to Coll...
Algebra
ISBN:9781337111348
Author:Bruce Crauder, Benny Evans, Alan Noell
Publisher:Cengage Learning
Algebra & Trigonometry with Analytic Geometry
Algebra
ISBN:9781133382119
Author:Swokowski
Publisher:Cengage
Glencoe Algebra 1, Student Edition, 9780079039897...
Algebra
ISBN:9780079039897
Author:Carter
Publisher:McGraw Hill
Big Ideas Math A Bridge To Success Algebra 1: Stu...
Algebra
ISBN:9781680331141
Author:HOUGHTON MIFFLIN HARCOURT
Publisher:Houghton Mifflin Harcourt
Correlation Vs Regression: Difference Between them with definition & Comparison Chart; Author: Key Differences;https://www.youtube.com/watch?v=Ou2QGSJVd0U;License: Standard YouTube License, CC-BY
Correlation and Regression: Concepts with Illustrative examples; Author: LEARN & APPLY : Lean and Six Sigma;https://www.youtube.com/watch?v=xTpHD5WLuoA;License: Standard YouTube License, CC-BY