
Concept explainers
Videos
To explain what do these data indicate about the height of a roller coaster and the length of the ride you can expect.
Answer to Problem 39E
They are moderately correlated.
Explanation of Solution
A survey of people were taken who responded to the discovery channel poll and reported the ten best roller coaster in United states. The information about the roller coaster, initial drop and the time of ride of the roller coaster is given in the question. To find about the association we will construct a
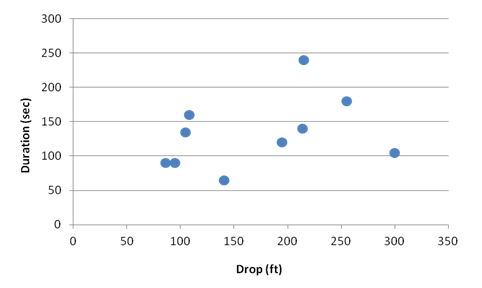
From the scatterplot on the above, the data do not suggest any significant
Chapter 7 Solutions
Stats: Modeling the World Nasta Edition Grades 9-12
Additional Math Textbook Solutions
Intro Stats, Books a la Carte Edition (5th Edition)
Statistics for Business and Economics (13th Edition)
Essentials of Statistics (6th Edition)
Basic Business Statistics, Student Value Edition (13th Edition)
Elementary Statistics Using Excel (6th Edition)
Introductory Statistics (2nd Edition)


 MATLAB: An Introduction with ApplicationsStatisticsISBN:9781119256830Author:Amos GilatPublisher:John Wiley & Sons Inc
 Probability and Statistics for Engineering and th...StatisticsISBN:9781305251809Author:Jay L. DevorePublisher:Cengage Learning
 Statistics for The Behavioral Sciences (MindTap C...StatisticsISBN:9781305504912Author:Frederick J Gravetter, Larry B. WallnauPublisher:Cengage Learning
 Elementary Statistics: Picturing the World (7th E...StatisticsISBN:9780134683416Author:Ron Larson, Betsy FarberPublisher:PEARSON
 The Basic Practice of StatisticsStatisticsISBN:9781319042578Author:David S. Moore, William I. Notz, Michael A. FlignerPublisher:W. H. Freeman
 Introduction to the Practice of StatisticsStatisticsISBN:9781319013387Author:David S. Moore, George P. McCabe, Bruce A. CraigPublisher:W. H. Freeman