
Concept explainers
Videos
(a)
To make a
(a)
Explanation of Solution
The information about the horsepower and the highway gas mileage is given in the question. The scatterplot for the same is given as follows:
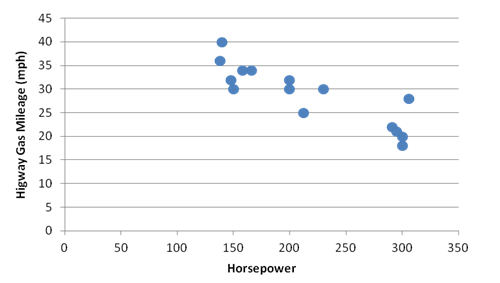
The horsepower is on the horizontal axis and the highway gas mileage is on the vertical axis.
(b)
To describe direction, strength and form of the plot.
(b)
Answer to Problem 33E
Direction is negative, form is linear and the strength is moderately strong.
Explanation of Solution
The information about the horsepower and the highway gas mileage is given in the question. And the scatterplot of the horsepower and the highway gas mileage is in part (a). By this we know that the association between the horsepower and the highway gas mileage is negative, linear and moderately strong since the points form a downward linear trend and the points are neither too clustered nor too scattered.
(c)
To find the
(c)
Answer to Problem 33E
The correlation between the horsepower and the highway gas mileage is
Explanation of Solution
The information about the horsepower and the highway gas mileage is given in the question. Then we will calculate the
| Horsepower | Highway gas mileage |
| 200 | 32 |
| 230 | 30 |
| 200 | 30 |
| 148 | 32 |
| 291 | 22 |
| 300 | 20 |
| 295 | 21 |
| 140 | 40 |
| 166 | 34 |
| 138 | 36 |
| 306 | 28 |
| 300 | 18 |
| 212 | 25 |
| 158 | 34 |
| 150 | 30 |
Formula used:
The CORREL
CORREL(array
Calculation:
Now, we will calculate the correlation coefficient using the excel. We will use the above CORREL function for this and we will have,
And the answer to this will be as:
| Correlation coefficient | -0.868682726 |
So, the correlation between the horsepower and the highway gas mileage is
(d)
To write a few sentences telling what the plot says about fuel economy.
(d)
Explanation of Solution
The information about the horsepower and the highway gas mileage is given in the question. And the correlation between the horsepower and the highway gas mileage is
Chapter 7 Solutions
Stats: Modeling the World Nasta Edition Grades 9-12
Additional Math Textbook Solutions
Introductory Statistics (10th Edition)
Basic Business Statistics, Student Value Edition
Intro Stats, Books a la Carte Edition (5th Edition)
Statistical Reasoning for Everyday Life (5th Edition)


 MATLAB: An Introduction with ApplicationsStatisticsISBN:9781119256830Author:Amos GilatPublisher:John Wiley & Sons Inc
 Probability and Statistics for Engineering and th...StatisticsISBN:9781305251809Author:Jay L. DevorePublisher:Cengage Learning
 Statistics for The Behavioral Sciences (MindTap C...StatisticsISBN:9781305504912Author:Frederick J Gravetter, Larry B. WallnauPublisher:Cengage Learning
 Elementary Statistics: Picturing the World (7th E...StatisticsISBN:9780134683416Author:Ron Larson, Betsy FarberPublisher:PEARSON
 The Basic Practice of StatisticsStatisticsISBN:9781319042578Author:David S. Moore, William I. Notz, Michael A. FlignerPublisher:W. H. Freeman
 Introduction to the Practice of StatisticsStatisticsISBN:9781319013387Author:David S. Moore, George P. McCabe, Bruce A. CraigPublisher:W. H. Freeman