
Concept explainers
Videos
(a)
To find the
(a)
Answer to Problem 42E
The correlation between flights with year is
Explanation of Solution
The number of flights by U.S. airlines has grown rapidly and the number of flights flown in each year from
| Year | Flights |
| 1995 | 53,27,435 |
| 1996 | 53,51,983 |
| 1997 | 54,11,843 |
| 1998 | 53,84,721 |
| 1999 | 55,27,884 |
| 2000 | 56,83,047 |
| 2001 | 59,67,780 |
| 2002 | 52,71,359 |
| 2003 | 64,88,539 |
| 2004 | 71,29,270 |
| 2005 | 71,40,596 |
We will be calculation the correlation between the year and fights by using excel. That is,
Formula used:
The CORREL
CORREL(array
Calculation:
Now, we will calculate the correlation coefficient using the excel. We will use the above CORREL function for this and we will have,
And the answer to this will be as:
| Correlation coefficient | 0.8275 |
So, the correlation between flights with yearis
(b)
To make a
(b)
Explanation of Solution
The scatterplot between the flights and the year is as follows:
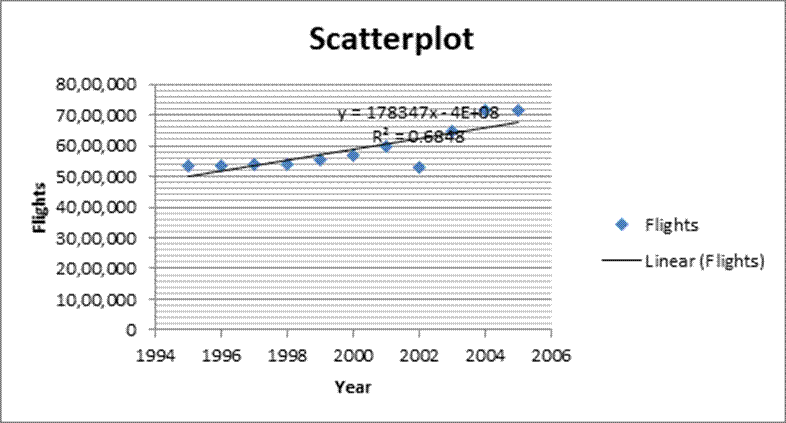
The number of flights is on the vertical axis and the year is on the horizontal axis. From the scatterplot on the above, we can say that the points are moving upwards and is positive. Thus, the association is positive and we can also see that the number of flights are increasing over the years or as the time increases.
(c)
To note two reasons that the correlation you found in part (a) is not suitable summary of the strength of the association and can you account for these violations of the conditions.
(c)
Answer to Problem 42E
First is in the year
Explanation of Solution
The number of flights by U.S. airlines has grown rapidly and the number of flights flown in each year from
Chapter 7 Solutions
Stats: Modeling the World Nasta Edition Grades 9-12
Additional Math Textbook Solutions
Basic Business Statistics, Student Value Edition (13th Edition)
Essentials of Statistics, Books a la Carte Edition (5th Edition)
Intro Stats, Books a la Carte Edition (5th Edition)
Introductory Statistics
Elementary Statistics: Picturing the World (7th Edition)
An Introduction to Mathematical Statistics and Its Applications (6th Edition)


 MATLAB: An Introduction with ApplicationsStatisticsISBN:9781119256830Author:Amos GilatPublisher:John Wiley & Sons Inc
 Probability and Statistics for Engineering and th...StatisticsISBN:9781305251809Author:Jay L. DevorePublisher:Cengage Learning
 Statistics for The Behavioral Sciences (MindTap C...StatisticsISBN:9781305504912Author:Frederick J Gravetter, Larry B. WallnauPublisher:Cengage Learning
 Elementary Statistics: Picturing the World (7th E...StatisticsISBN:9780134683416Author:Ron Larson, Betsy FarberPublisher:PEARSON
 The Basic Practice of StatisticsStatisticsISBN:9781319042578Author:David S. Moore, William I. Notz, Michael A. FlignerPublisher:W. H. Freeman
 Introduction to the Practice of StatisticsStatisticsISBN:9781319013387Author:David S. Moore, George P. McCabe, Bruce A. CraigPublisher:W. H. Freeman