
Videos
Previous studies have shown that supplementing the diet with oat bran may lower serum-cholesterol levels. However, it is not known whether the cholesterol is reduced by a direct effect of oat bran or by replacing fatty foods in the diet. To address this question, a study was performed to compare the effect of dietary supplementation with high-fiber oat bran (87 g/day) to dietary supplementation with a low-fiber refined wheat product on the serum cholesterol of 20 healthy participants ages 23-49 years [3]. Each subject had a cholesterol level measured at baseline and then was randomly assigned to receive either a high-fiber or a low-fiber diet for 6 weeks. A 2-week period followed during which no supplements were taken. Participants then took the alternate supplement for a 6-week period. The results are shown in Table 7.7.
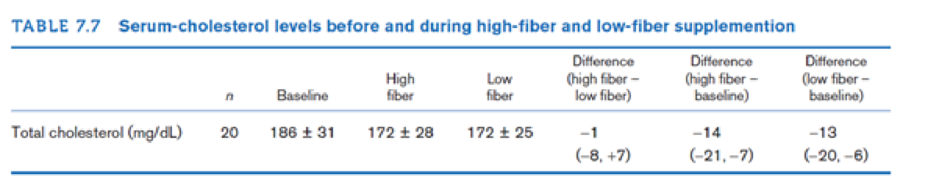
Note: Plus-minus (±) value are
How many participants would be needed to have a 90% chance of finding a significant difference in mean cholesterol lowering between the high- and low-fiber diets if the high-fiber diet lowers mean cholesterol by 5 mg/dL more than the low-fiber diet and a two-sided test is used with significance level = .05?
Want to see the full answer?
Check out a sample textbook solution
Chapter 7 Solutions
EBK FUNDAMENTALS OF BIOSTATISTICS


- My previous classmate researched on the relationship between children’s nutrition and their cognitive development and found out that children have less energy and less interest for learning when under-nutrition. What is the independent, dependent and extraaneous variable?arrow_forwardIn North America, between 100 million and 1 billion birds die each year by crashing into windows on buildings, more than any other human-related cause. This figure represents up to 5% of all birds in the area. One possible solution is to construct windows angled downward slightly so that they reflect the ground rather than an image of the sky to a flying bird. An experiment by Klem et al. (2004) compared the number of birds that died as a result of vertical windows, windows angled 20 degrees off vertical, and windows angled 40 degrees off vertical. The angles were randomly assigned with equal probability to six windows and changed daily; assume for this exercise that windows and window locations were identical in every respect except angle. Over the course of the experiment, 30 birds were killed by windows in the vertical orientation, 15 were killed by windows set at 20 degrees off vertical, and 8 were killed by windows set at 40 degrees off vertical. a. Clearly state an appropriate…arrow_forwardThere have been many studies recently concerning coffee drinking and cholesterol level. While it is known that several coffee-bean components can elevate blood cholesterol level, it is thought that a new type of paper coffee filter may reduce the presence of some of these components in coffee. The effect of the new filter on cholesterol level will be studied over a 10-week period using 300 nonsmokers who each drink 4 cups of caffeinated coffee per day. Each of these 300 participants will be assigned to one of two groups: the experimental group, who will only drink coffee that has been made with the new filter, or the control group, who will only drink coffee that has been made with the standard filter. Each participant’s cholesterol level will be measured at the beginning and at the end of the study. Describe an appropriate method for assigning the subjects to the two groups so that each group will have an equal number of subjects. In this study, the researchers chose to include a…arrow_forward
- There have been many studies recently concerning coffee drinking and cholesterol level. While it is known that several coffee-bean components can elevate blood cholesterol level, it is thought that a new type of paper coffee filter may reduce the presence of some of these components in coffee. The effect of the new filter on cholesterol level will be studied over a 10-week period using 300 nonsmokers who each drink 4 cups of caffeinated coffee per day. Each of these 300 participants will be assigned to one of two groups: the experimental group, who will only drink coffee that has been made with the new filter, or the control group, who will only drink coffee that has been made with the standard filter. Each participant’s cholesterol level will be measured at the beginning and at the end of the study. Which test would you conduct to determine whether the change in cholesterol level would be greater if people used the new filter rather than using the standard filter? Why would the…arrow_forwardIron is an integral part of many proteins and enzymes that maintain good health. Recommendations for iron were developed by an institute of medicine for a certain region. The recommended dietary allowance (RDA) of iron for adult females under the age of 51 years is 17.5 milligrams (mg) per day. A hypothesis test is to be performed to decide whether adult females under the age of 51 years are, on average, getting more than the RDA of 17.5 mg of iron per day. Complete parts (a) through (c). a. Determine the null hypothesis. Ho: H mg (Type an integer or a decimal. Do not round.)arrow_forwardIn North America, between 100 million and 1 billion birds die each year by crashing into windows on buildings, more than any other human-related cause. This figure represents up to 5% of all birds in the area. One possible solution is to construct windows angled downward slightly, so that they reflect the ground rather than an image of the sky to a flying bird. An experiment by Klem et al. (2004) compared the number of birds that died as a result of vertical windows, windows angled 20 degrees off vertical, and windows angled 40 degrees off vertical. The angles were randomly assigned with equal probability to six windows and changed daily; assume for this exercise that windows and window locations were identical in every respect except angle. Over the course of the experiment, 30 birds were killed by windows in the vertical orientation, 15 were killed by windows set at 20 degrees off vertical, and 8 were killed by windows set at 40 degrees off vertical. . Clearly state an appropriate…arrow_forward
- A group of 10-year-old boys were first ascertained in a camp for diabetic boys. They had their weight measured at baseline and again when they returned to camp 1 year later. Each time, a serum sample was obtained from which a determination of hemoglobin A1c (HgbA1c) was made. HgbA1c (also called glycosylated hemoglobin) is routinely used to monitor compliance with taking insulin injections. Usually, the poorer the compliance, the higher the HgbA1c level will be. The hypothesis is that the level HgbA1c is related to weight. The data in Table 11.28 were obtained. 11.92 What test can be performed to assess the relationship between weight and HgbA1c at the initial visit? 11.93 Please perform the test in Problem 11.92, and report a two-tailed p-value. 11.94 Do the results in Problem 11.93 imply a relationship between change in HgbA1c and change in weight for an individual boy? Why or why not?arrow_forwardA group of 10-year-old boys were first ascertained in a camp for diabetic boys. They had their weight measured at baseline and again when they returned to camp 1 year later. Each time, a serum sample was obtained from which a determination of hemoglobin A1c (HgbA1c) was made. HgbA1c (also called glycosylated hemoglobin) is routinely used to monitor compliance with taking insulin injections. Usually, the poorer the compliance, the higher the HgbA1c level will be. The hypothesis is that the level HgbA1c is related to weight. The data in Table 11.28 were obtained. 11.95 Compute a rank correlation between change in weight and change in HgbA1c, each over 1 year. Use this measure to directly test the hypothesis that change in weight over 1 year is related to change in HgbA1c. Report a two-tailed p-value, and provide a 95% confidence interval for the underlying rank correlation.arrow_forwardA medical student at a community college in city Q wants to study the factors affecting the systolic blood pressure of a person (Y) Generally, the systolic blood pressure depends on the BMI of a person (B) and the age of the person A. She wants to test whether or not the BMI has a significant effect on the systolic blood pressure, keeping the age of the person constant. For her study, she collects a random sample of 125 patients from the city and estimates the following regression function: Y= 15.50 + 0..90B+1.15A. (0.55) (0 40) The test statistic of the study the student wants to conduct (Ho: B, = 0 vs. H, B, #0), keeping other variables constant is. (Round your answer to two decimal places.) At the 5% significance level, the student will ▼ the null hypothesis. Keeping BMIl constant, she now wants to test whether the age of a person (A) has no significant effect or a positive effect on the person's systolic blood pressure. So, the test statistic associated with the one-sided test the…arrow_forward
- A study published by Babcock and Marks (2010) showed that the average full-time U.S. college student studied for μ = 14 hours per week (SD = 4.8 hours per week) in 2005. We want to know if this average has changed in the past 15 years. In other words, we are going to do a study in which we try to determine whether there has been an impact of the passage of time on the amount of time college students spend studying. We selected a sample of n = 64 of today’s college students and find that they spent an average of M = 12.5 hours per week studying. Does this sample indicate a significant change in the number of hours spent studying? Use a two-tailed test (this means non-directional hypothesis) with α = .05.arrow_forwardDuring the spring of 1999, many fuel storage facilities in Serbia were destroyed by bombing. As a result, significant quantities of oil products were spilled and burned, resulting in soil pollution. An article reports measurements of heavy metal concentrations at several industrial sites in June 1999, just after the bombing, and again in March of 2000. At the Smederevo site, on the banks of the Danube River, eight soil specimens taken in 1999 had an average lead concentration (in mg/kg) of 10.7 with a standard deviation of 3.3. Ten specimens taken in 2000 had an average lead concentration of 33.8 with a standard deviation of 0.50. Let μXμX represent the population mean for the year 2000 and let μYμY represent the population mean for the year 1999. Find a 95% confidence interval for the difference μX−μYμX−μY . Round down the degrees of freedom to the nearest integer and round the answers to three decimal places. The 95% confidence interval is ( , ).arrow_forwardDuring the spring of 1999, many fuel storage facilities in Serbia were destroyed by bombing. As a result, significant quantities of oil products were spilled and burned, resulting in soil pollution. An article reports measurements of heavy metal concentrations at several industrial sites in June 1999, just after the bombing, and again in March of 2000. At the Smederevo site, on the banks of the Danube River, eight soil specimens taken in 1999 had an average lead concentration (in mg/kg) of 10.7 with a standard deviation of 3.3. Seven specimens taken in 2000 had an average lead concentration of 33.8 with a standard deviation of 0.50. Let ux represent the population mean for the year 2000 and let uY represent the population mean for the year 1999. Find a 95% confidence interval for the difference µx – µy . Round down the degrees of freedom to the nearest integer and round the answers to three decimal places. The 95% confidence interval isarrow_forward
 MATLAB: An Introduction with ApplicationsStatisticsISBN:9781119256830Author:Amos GilatPublisher:John Wiley & Sons Inc
 Probability and Statistics for Engineering and th...StatisticsISBN:9781305251809Author:Jay L. DevorePublisher:Cengage Learning
 Statistics for The Behavioral Sciences (MindTap C...StatisticsISBN:9781305504912Author:Frederick J Gravetter, Larry B. WallnauPublisher:Cengage Learning
 Elementary Statistics: Picturing the World (7th E...StatisticsISBN:9780134683416Author:Ron Larson, Betsy FarberPublisher:PEARSON
 The Basic Practice of StatisticsStatisticsISBN:9781319042578Author:David S. Moore, William I. Notz, Michael A. FlignerPublisher:W. H. Freeman
 Introduction to the Practice of StatisticsStatisticsISBN:9781319013387Author:David S. Moore, George P. McCabe, Bruce A. CraigPublisher:W. H. Freeman