
Concept explainers
Videos
(a)
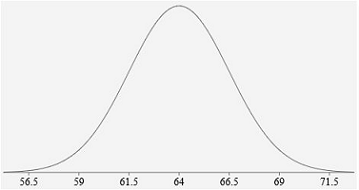
To graph: The population distribution.
(a)
Explanation of Solution
Given information:
Mean,
Standard deviation,
Number of 16-year old females = 300
Number of 16-year old females for SRS = 20
The population distribution =
The dotplot:
Given that the population distribution is
This means that the mean and standard deviation of the
So,
The required graph of the population distribution can be drawn by using the general form of normal distribution whose mean is
Thus, the required graph is shown below:
(b)
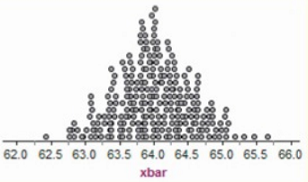
To graph: The distribution of sample data for the SRS of size 20 taken by the AP Statistics class.
(b)
Explanation of Solution
Given information:
Mean,
Standard deviation,
Number of 16-year old females = 300
Number of 16-year old females for SRS = 20
The population distribution =
The dotplot:

Given that the number of females for the SRS is 20.
Also, the population distribution is
This means that the mean and standard deviation of the normal distribution are 64 and 2.5 respectively.
So,
The histogram of the given data is shown below:
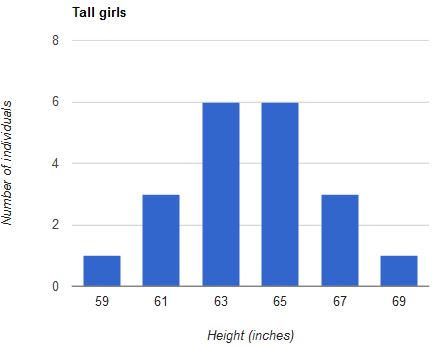
In the above histogram, widths of the bars are equal and the heights of the bars are the number of students. The bars in the histogram are roughly centered about 64 and the ranges of values are between 2 standard deviations of the mean.
The dotplot of the given data is shown below:
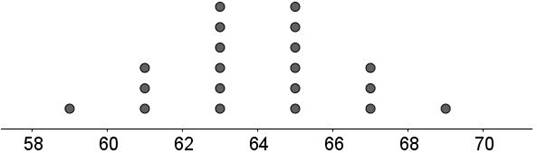
The dots in the dotplot are roughly centered about 64 and the ranges of values are between 2 standard deviations of the mean.
Chapter 7 Solutions
The Practice of Statistics for AP - 4th Edition
Additional Math Textbook Solutions
Statistical Reasoning for Everyday Life (5th Edition)
Introductory Statistics (10th Edition)
Elementary Statistics (13th Edition)
Introductory Statistics
Basic Business Statistics, Student Value Edition (13th Edition)


 MATLAB: An Introduction with ApplicationsStatisticsISBN:9781119256830Author:Amos GilatPublisher:John Wiley & Sons Inc
 Probability and Statistics for Engineering and th...StatisticsISBN:9781305251809Author:Jay L. DevorePublisher:Cengage Learning
 Statistics for The Behavioral Sciences (MindTap C...StatisticsISBN:9781305504912Author:Frederick J Gravetter, Larry B. WallnauPublisher:Cengage Learning
 Elementary Statistics: Picturing the World (7th E...StatisticsISBN:9780134683416Author:Ron Larson, Betsy FarberPublisher:PEARSON
 The Basic Practice of StatisticsStatisticsISBN:9781319042578Author:David S. Moore, William I. Notz, Michael A. FlignerPublisher:W. H. Freeman
 Introduction to the Practice of StatisticsStatisticsISBN:9781319013387Author:David S. Moore, George P. McCabe, Bruce A. CraigPublisher:W. H. Freeman