The Practice of Statistics for AP - 4th Edition
4th Edition
ISBN: 9781429245593
Author: Starnes, Daren S., Yates, Daniel S., Moore, David S.
Publisher: Macmillan Higher Education
bartleby

Concept explainers

bartleby

Videos

Question
Book Icon
Chapter 7.1, Problem 26E

a.

To determine

To find: The equation of the least square regression line.

a.

Expert Solution
Check Mark

Answer to Problem 26E

The equation of the regression line is y^=1.4146+0.4399x

Explanation of Solution

Given:

The output is:

  The Practice of Statistics for AP - 4th Edition, Chapter 7.1, Problem 26E

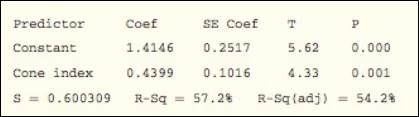
The general equation of the regression line is written as:

  y^=a+bxa is the y-interceptb is the slope coefficient

Using the provided information, the general equation of the regression line could be written as:

  y^=a+bxy^=1.4146+0.4399x

Thus, the equation of the regression line is y^=1.4146+0.4399x

b.

To determine

To explain: The linearity of the model using the residual plot.

b.

Expert Solution
Check Mark

Explanation of Solution

In the residual plot, no pattern could be seen and it is centered around the 0 which implies that it is a good linear model.

c.

To determine

To explain: The r2 and s .

c.

Expert Solution
Check Mark

Explanation of Solution

Here, r2 is 57.2% and it implies that 57.2% of the variation are being described by the regression model.

The value of s shows that the average number of errors being made are 0.6000309.

Chapter 7 Solutions

The Practice of Statistics for AP - 4th Edition

Ch. 7.1 - Prob. 3ECh. 7.1 - Prob. 4ECh. 7.1 - Prob. 5ECh. 7.1 - Prob. 6ECh. 7.1 - Prob. 7ECh. 7.1 - Prob. 8ECh. 7.1 - Prob. 9ECh. 7.1 - Prob. 10ECh. 7.1 - Prob. 11ECh. 7.1 - Prob. 12ECh. 7.1 - Prob. 13ECh. 7.1 - Prob. 14ECh. 7.1 - Prob. 15ECh. 7.1 - Prob. 16ECh. 7.1 - Prob. 17ECh. 7.1 - Prob. 18ECh. 7.1 - Prob. 19ECh. 7.1 - Prob. 20ECh. 7.1 - Prob. 21ECh. 7.1 - Prob. 22ECh. 7.1 - Prob. 23ECh. 7.1 - Prob. 24ECh. 7.1 - Prob. 25ECh. 7.1 - Prob. 26ECh. 7.2 - Prob. 1.1CYUCh. 7.2 - Prob. 1.2CYUCh. 7.2 - Prob. 1.3CYUCh. 7.2 - Prob. 1.4CYUCh. 7.2 - Prob. 27ECh. 7.2 - Prob. 28ECh. 7.2 - Prob. 29ECh. 7.2 - Prob. 30ECh. 7.2 - Prob. 31ECh. 7.2 - Prob. 32ECh. 7.2 - Prob. 33ECh. 7.2 - Prob. 34ECh. 7.2 - Prob. 35ECh. 7.2 - Prob. 36ECh. 7.2 - Prob. 37ECh. 7.2 - Prob. 38ECh. 7.2 - Prob. 39ECh. 7.2 - Prob. 40ECh. 7.2 - Prob. 41ECh. 7.2 - Prob. 42ECh. 7.2 - Prob. 43ECh. 7.2 - Prob. 44ECh. 7.2 - Prob. 45ECh. 7.2 - Prob. 46ECh. 7.2 - Prob. 47ECh. 7.2 - Prob. 48ECh. 7.3 - Prob. 1.1CYUCh. 7.3 - Prob. 1.2CYUCh. 7.3 - Prob. 1.3CYUCh. 7.3 - Prob. 1.4CYUCh. 7.3 - Prob. 49ECh. 7.3 - Prob. 50ECh. 7.3 - Prob. 51ECh. 7.3 - Prob. 52ECh. 7.3 - Prob. 53ECh. 7.3 - Prob. 54ECh. 7.3 - Prob. 55ECh. 7.3 - Prob. 56ECh. 7.3 - Prob. 57ECh. 7.3 - Prob. 58ECh. 7.3 - Prob. 59ECh. 7.3 - Prob. 60ECh. 7.3 - Prob. 61ECh. 7.3 - Prob. 62ECh. 7.3 - Prob. 63ECh. 7.3 - Prob. 64ECh. 7.3 - Prob. 65ECh. 7.3 - Prob. 66ECh. 7.3 - Prob. 67ECh. 7.3 - Prob. 68ECh. 7.3 - Prob. 69ECh. 7.3 - Prob. 70ECh. 7.3 - Prob. 71ECh. 7.3 - Prob. 72ECh. 7 - Prob. 1CRECh. 7 - Prob. 2CRECh. 7 - Prob. 3CRECh. 7 - Prob. 4CRECh. 7 - Prob. 5CRECh. 7 - Prob. 6CRECh. 7 - Prob. 7CRECh. 7 - Prob. 1PTCh. 7 - Prob. 2PTCh. 7 - Prob. 3PTCh. 7 - Prob. 4PTCh. 7 - Prob. 5PTCh. 7 - Prob. 6PTCh. 7 - Prob. 7PTCh. 7 - Prob. 8PTCh. 7 - Prob. 9PTCh. 7 - Prob. 10PTCh. 7 - Prob. 11PTCh. 7 - Prob. 12PTCh. 7 - Prob. 13PTCh. 7 - Prob. 1PT2Ch. 7 - Prob. 2PT2Ch. 7 - Prob. 3PT2Ch. 7 - Prob. 4PT2Ch. 7 - Prob. 5PT2Ch. 7 - Prob. 6PT2Ch. 7 - Prob. 7PT2Ch. 7 - Prob. 8PT2Ch. 7 - Prob. 9PT2Ch. 7 - Prob. 10PT2Ch. 7 - Prob. 11PT2Ch. 7 - Prob. 12PT2Ch. 7 - Prob. 13PT2Ch. 7 - Prob. 14PT2Ch. 7 - Prob. 15PT2Ch. 7 - Prob. 16PT2Ch. 7 - Prob. 17PT2Ch. 7 - Prob. 18PT2Ch. 7 - Prob. 19PT2Ch. 7 - Prob. 20PT2Ch. 7 - Prob. 21PT2Ch. 7 - Prob. 22PT2Ch. 7 - Prob. 23PT2Ch. 7 - Prob. 24PT2Ch. 7 - Prob. 25PT2
Knowledge Booster
Background pattern image
Statistics
Learn more about
Need a deep-dive on the concept behind this application? Look no further. Learn more about this topic, statistics and related others by exploring similar questions and additional content below.
Recommended textbooks for you
Text book image
MATLAB: An Introduction with Applications
Statistics
ISBN:9781119256830
Author:Amos Gilat
Publisher:John Wiley & Sons Inc
Text book image
Probability and Statistics for Engineering and th...
Statistics
ISBN:9781305251809
Author:Jay L. Devore
Publisher:Cengage Learning
Text book image
Statistics for The Behavioral Sciences (MindTap C...
Statistics
ISBN:9781305504912
Author:Frederick J Gravetter, Larry B. Wallnau
Publisher:Cengage Learning
Text book image
Elementary Statistics: Picturing the World (7th E...
Statistics
ISBN:9780134683416
Author:Ron Larson, Betsy Farber
Publisher:PEARSON
Text book image
The Basic Practice of Statistics
Statistics
ISBN:9781319042578
Author:David S. Moore, William I. Notz, Michael A. Fligner
Publisher:W. H. Freeman
Text book image
Introduction to the Practice of Statistics
Statistics
ISBN:9781319013387
Author:David S. Moore, George P. McCabe, Bruce A. Craig
Publisher:W. H. Freeman
Correlation Vs Regression: Difference Between them with definition & Comparison Chart; Author: Key Differences;https://www.youtube.com/watch?v=Ou2QGSJVd0U;License: Standard YouTube License, CC-BY
Correlation and Regression: Concepts with Illustrative examples; Author: LEARN & APPLY : Lean and Six Sigma;https://www.youtube.com/watch?v=xTpHD5WLuoA;License: Standard YouTube License, CC-BY