
Videos
(a)
To find: the evidence that less than 60% of all students completed their assigned homework last week.
(a)
Explanation of Solution
Given:
Formula used:
Calculation:
Sample proportion is
It is observed that the sample proportion 45% is less than the claimed 60% and therefore the sample proportion is evidence that the less than 60% of all students at the school completed their assigned homework last week.
(b)
To find: the two explanations for the evidence described in part (a).
(b)
Answer to Problem 13E
Sample proportion is 45% which is less than 60%
Explanation of Solution
Given:
Formula used:
Calculation:
Sample proportion is
It is possible that the sample proportion is less than 60% the reason behind is that the population proportion is actually 60% and it is obtained a sample with a sample proportion of only 45% by chance.
Although, it is also possible that the sample proportion is less than 60% the reason behind is that the population proportion is actually less than 60%.
(c)
To Explain: the value represents.
(c)
Explanation of Solution
Given:

By seeing the dot plot it represents a sample proportion
The dot at 0.73 represents one simple random sample of students which 73 of the 100 students completed their assigned homework last week.
(d)
To find: that it is surprising to get a sample proportion of 0.45 or smaller in an SRS of size 100 when p = 0.60.
(d)
Answer to Problem 13E
Yes
Explanation of Solution
Given:

Each dot in the given dot plot represents a sample proportion
It is observed that there are no dots above 0.45 in the dot plot nor are there any dots to the left of 0.45.This then indicates that it is very unlikely that the sample proportion is
(e)
To find: that is there convincing evidence that less than 60% of all students at the school completed their assigned homework last week.
(e)
Explanation of Solution
Given:
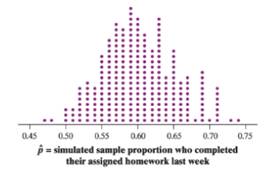
Each dot in the given dot plot represents a sample proportion
It is observed that there are no dots above 0.45 in the dot plot nor are there any dots to the left of 0.45.This then indicates that it is very unlikely that the sample proportion is
Chapter 7 Solutions
PRACTICE OF STATISTICS F/AP EXAM
Additional Math Textbook Solutions
Basic Business Statistics, Student Value Edition
Introductory Statistics (2nd Edition)
STATS:DATA+MODELS-W/DVD
Elementary Statistics (13th Edition)
Elementary Statistics


 MATLAB: An Introduction with ApplicationsStatisticsISBN:9781119256830Author:Amos GilatPublisher:John Wiley & Sons Inc
 Probability and Statistics for Engineering and th...StatisticsISBN:9781305251809Author:Jay L. DevorePublisher:Cengage Learning
 Statistics for The Behavioral Sciences (MindTap C...StatisticsISBN:9781305504912Author:Frederick J Gravetter, Larry B. WallnauPublisher:Cengage Learning
 Elementary Statistics: Picturing the World (7th E...StatisticsISBN:9780134683416Author:Ron Larson, Betsy FarberPublisher:PEARSON
 The Basic Practice of StatisticsStatisticsISBN:9781319042578Author:David S. Moore, William I. Notz, Michael A. FlignerPublisher:W. H. Freeman
 Introduction to the Practice of StatisticsStatisticsISBN:9781319013387Author:David S. Moore, George P. McCabe, Bruce A. CraigPublisher:W. H. Freeman