
Concept explainers
Videos
To find: the minimum age for each sample and display the sampling distribution of the sample minimum on a dot plot with the same scale as the dot plot.
Answer to Problem 22E
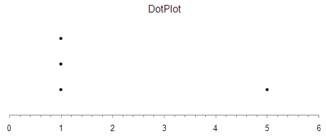
Dot plot with
The sampling variability decreases as the sample size increases.
Explanation of Solution
Given:
| Car number | color | Age |
| 1 | Red | 1 |
| 2 | White | 5 |
| 3 | Sliver | 8 |
| 4 | Red | 20 |
Calculation:
All possible sample of size 3 is
| Sample of size 3 |
| 1,2,3 |
| 1,2,4 |
| 1,3,4 |
| 2,3,4 |
The sample minimum is the smallest age of the three cars
| Sample of size 3 | Sample minimum |
| 1,2,3 | |
| 1,2,4 | |
| 1,3,4 | |
| 2,3,4 |
Graph:
Variability
In the previous exercise, the dots in the dot plots
The dots in the above dot plot range from 1 to 5.
This then means that the dot plot with sample size
This then is also indicating that the sampling variability decreases as the sample size increases.
Chapter 7 Solutions
PRACTICE OF STATISTICS F/AP EXAM
Additional Math Textbook Solutions
Essentials of Statistics, Books a la Carte Edition (5th Edition)
Statistical Reasoning for Everyday Life (5th Edition)
STATS:DATA+MODELS-W/DVD
Introductory Statistics (10th Edition)
An Introduction to Mathematical Statistics and Its Applications (6th Edition)


 MATLAB: An Introduction with ApplicationsStatisticsISBN:9781119256830Author:Amos GilatPublisher:John Wiley & Sons Inc
 Probability and Statistics for Engineering and th...StatisticsISBN:9781305251809Author:Jay L. DevorePublisher:Cengage Learning
 Statistics for The Behavioral Sciences (MindTap C...StatisticsISBN:9781305504912Author:Frederick J Gravetter, Larry B. WallnauPublisher:Cengage Learning
 Elementary Statistics: Picturing the World (7th E...StatisticsISBN:9780134683416Author:Ron Larson, Betsy FarberPublisher:PEARSON
 The Basic Practice of StatisticsStatisticsISBN:9781319042578Author:David S. Moore, William I. Notz, Michael A. FlignerPublisher:W. H. Freeman
 Introduction to the Practice of StatisticsStatisticsISBN:9781319013387Author:David S. Moore, George P. McCabe, Bruce A. CraigPublisher:W. H. Freeman