
Videos
The depth of wetting of a soil is the depth to which water content will increase owing to external factors. The article “Discussion of Method for Evaluation of Depth of Wetting in Residential Areas” (J. Nelson, K. Chao, and D. Overton, Journal of Geotechnical and Geoenvironmental Engineering, 2011:293–296) discusses the relationship between depth of wetting beneath a structure and the age of the structure. The article presents measurements of depth of wetting, in meters, and the ages, in years, of 21 houses, as shown in the following table.
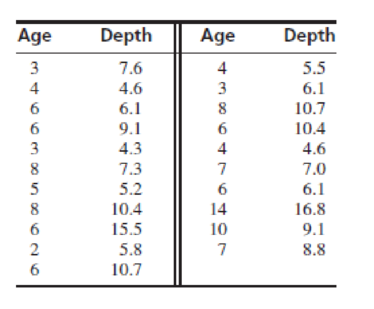
- a. Compute the least-squares line for predicting depth of wetting (y) from age (x).
- b. Identify a point with an unusually large x-value. Compute the least-squares line that results from deletion of this point.
- c. Identify another point which can be classified as an outlier. Compute the least-squares line that results from deletion of the outlier, replacing the point with the unusually large x-value.
- d. Which of these two points is more influential? Explain.
Want to see the full answer?
Check out a sample textbook solution
Chapter 7 Solutions
STATISTICS FOR ENGR.+SCI.(LL)-W/ACCESS
Additional Math Textbook Solutions
Stats: Modeling the World Nasta Edition Grades 9-12
STATS:DATA+MODELS-W/DVD
Statistics Through Applications
Elementary Statistics Using The Ti-83/84 Plus Calculator, Books A La Carte Edition (5th Edition)
Introduction to Statistical Quality Control
Fundamentals of Statistics (5th Edition)


- The aging Neotropical termites (Neocapritermes taracua) secrete a sticky, blue-colored liquid that they spew to intruding termites. The younger Neotropical termites secrete a liquid that lacks the blue component, so it is white in appearance. In an experiment that measured the toxicity of the blue substance, the researchers placed one drop of either the blue liquid or the white liquid on individuals of a second termite species, Labiotermes labralis. Of the 41 Labiotermes labralis that got the blue drop, 37 were immobilized. Of the 40 Labiotermes labralis that got the white drop, 9 were immobilized. Is the blue liquid toxic compared to the white liquid?arrow_forwardThe spike stature of the plants grown from the seeds of the porcine separates (Dactylis glomerata L) collected from the University campus and İbradı Eynif pasture are given below. In this plant, compare whether there is a difference between regions in terms of spike height. Virgo Height (cm) Data obtained from plants collected from university campus 5 6 8 7 8 6 5 5 4 6 6 Data obtained from plants collected from Eynif pasture 12 9 11 9 9 11 9 10 11 10 Note: Your results interpretation according to two different possibilities (Do it separately, assuming that it is 0.07 and 0.04).arrow_forwardDuring the spring of 1999, many fuel storage facilities in Serbia were destroyed by bombing. As a result, significant quantities of oil products were spilled and burned,resulting in soil pollution. The article “Mobility of Heavy Metals Originating from Bombing of Industrial Sites” (B. Škrbić, J. Novaković, and N. Miljević, Journal of Environmental Science and Health, 2002:7–16) reports measurements of heavy metal concentrations at several industrial sites in June 1999, just after the bombing, and again in March of 2000. At the Smederevo site, on the banks of the Danube River, eight soil specimens taken in 1999 had an average lead concentration (in mg/kg) of 10.7 with a standard deviation of 3.3. Four specimens taken in 2000 had an average lead concentration of 33.8 with a standard deviation of 0.50. Find a 95% confidence interval for the increase in lead concentration between June 1999 and March 2000.arrow_forward
- The article “Withdrawal Strength of Threaded Nails” (D. Rammer, S. Winistorfer, and D. Bender, Journal of Structural Engineering 2001:442–449) describes an experiment comparing the ultimate withdrawal strengths (in N/mm) for several types of nails. For an annularly threaded nail with shank diameter 3.76 mm driven into spruce-pine-fir lumber, the ultimate withdrawal strength was modeled as lognormal with μ = 3.82 and σ = 0.219. For a helically threaded nail under the same conditions, the strength was modeled as lognormal with μ = 3.47 and σ = 0.272. a) What is the mean withdrawal strength for annularly threaded nails? b) What is the mean withdrawal strength for helically threaded nails? c) For which type of nail is it more probable that the withdrawal strength will be greater than 50 N/mm? d) What is the probability that a helically threaded nail will have a greater withdrawal strength than the median for annularly threaded nails? e) An experiment is performed in which withdrawal…arrow_forwardThe performance of two analysts in determining total mercury (mg / kg) in fish was evaluated using the absorption spectrometry method. The results on the concentrations of mercury found in fish, for each analyst, are presented in the table below: Analyst 1 Analyst 2 7 12 9 8 6 9 11 13 13 14 8 9 7 8 13 10 12 7 9 15 (a)Is the performance in determining total mercury for Analyst 1 more accurate than Analyst 2? Compare the accuracy in the results of the two analysts at a 95% confidence level. Explain. (b)Are the results obtained by the two analysts, in the concentrations of mercury found in the fish, statistically equivalent, with 95% confidence? Explainarrow_forwardThe article “Differences in Susceptibilities of Different Cell Lines to Bilirubin Damage” (K. Ngai, C. Yeung, and C. Leung, Journal of Paediatric Child Health, 2000:36–45) reports an investigation into the toxicity of bilirubin on several cell lines. Ten sets of human liver cells and 10 sets of mouse fibroblast cells were placed into solutions of bilirubin in albumin with a 1.4 bilirubin/albumin molar ratio for 24 hours. In the 10 sets of human liver cells, the average percentage of cells surviving was 53.9 with a standard deviation of 10.7. In the 10 sets of mouse fibroblast cells, the average percentage of cells surviving was 73.1 with a standard deviation of 9.1. Find a 98% confidence interval for the difference in survival percentages between the two cell lines.arrow_forward
- Here is a dataset containing plant growth measurements of plants grown in solutions of commonly-found chemicals in roadway runoff.Phragmites australis, a fast-growing non-native grass common to roadsides and disturbed wetlands of Tidewater Virginia, was grown in a greenhouse and watered with either: Distilled water (control); A weak petroleum solution (representing standard roadway runoff); Sodium chloride solution; Magnesium chloride solution; De-icing brine (50% sodium chloride and 50% magnesium chloride).Twenty grass preparations were used for each solution, and total growth (in cm) was recorded after watering every other day for 40 days.-Perform the correct statistical test to determine the p-value.-Report your answer rounded to four decimal places.-You should use formulas, functions, and the Data Analysis ToolPak in MS Excel to avoid additive rounding errors. Here are some useful functions: =t.test(array1,array2,tails,type) Produces a p-value for any…arrow_forwardAn article in Knee Surgery, Sports Traumatology, Arthroscopy, "Arthroscopic meniscal repair with an absorbable screw: results and surgical technique," (2005, Vol. 13, pp. 273-279) cites a success rate of 1% for meniscal tears with a rim width of less than 3 mm, and a 1% success rate for tears from 3-6 mm. If you are unlucky enough to suffer a meniscal tear of less than 3 mm on your left knee, and one of width 3-6 mm on your right knee, what is the probability that you have exactly one successful surgery? assume surgieries are independent.arrow_forwardResearchers interested in lead exposure due to car exhaust sampled the blood of 52 police officers subjected to constant inhalation of automobile exhaust fumes while working traffic enforcement in a primarily urban environment. The blood samples of these officers had an average lead concentration of 124.32 µg/l and a SD of 37.74 µg/l; a previous study of individuals from a nearby suburb, with no history of exposure, found an average blood level concentration of 35 µg/l. Test the hypothesis that the downtown police officers have a higher lead exposure than the group in the previous study. Interpret your results in context. Based on your preceding result, without performing a calculation, would a 99% confidence interval for the average blood concentration level of police officers contain 35 µg/l? Based on your preceding result, without performing a calculation, would a 99% confidence interval for this difference contain 0? Explain why or why not.arrow_forward
- An article in Technometrics (1974, Vol. 16, pp. 523–531) considered the following stack-loss data from a plant oxidizing ammonia to nitric acid. Twenty-one daily responses of stack loss (the amount of ammonia escaping) were measured with air flow x1, temperature x2, and acid concentration x3. y = 42, 37, 37, 28, 18, 18, 19, 20, 15, 14, 14, 13, 11, 12, 8, 7, 8, 8, 9, 15, 15 x1 = 80, 80, 75, 62, 62, 62, 62, 62, 58, 58, 58, 58, 58, 58, 50, 50, 50, 50, 50, 56, 70 x2 = 27, 27, 25, 24, 22, 23, 24, 24, 23, 18, 18, 17, 18, 19, 18, 18, 19, 19, 20, 20, 20 x3 = 89, 88, 90, 87, 87, 87, 93, 93, 87, 80, 89, 88, 82, 93, 89, 86, 72, 79, 80, 82, 91 (a) Fit a linear regression model relating the results of the stack loss to the three regressor variables. (b) Estimate σ2. (c) Find the standard error se(βj). (d) Use the model in part (a) to predict stack loss when x1 = 60, x2 = 26, and x3 = 85.arrow_forwardThe sulfate ion concentration in natural water can be determined by measuring the turbidity that results when an excess of BaCl2 is added to a measured quantity of the sample. A turbiditimeter, the instrument used for this analysis, was calibrated with a series of standard Na2SO4 solutions. The following data were obtained for the calibration:arrow_forwardIn the article “Groundwater Electromagnetic Imaging in Complex Geological and Topographical Regions: A Case Study of a Tectonic Boundary in the French Alps” (S. Houtot, P. Tarits, et al., Geophysics, 2002:1048–1060), the pH was measured for several water samples in various locations near Gittaz Lake in the French Alps. The results for 11 locations on the northern side of the lake and for 6 locations on the southern side are as follows: Northern side: 8.1 8.2 8.1 8.2 8.2 7.4 7.3 7.4 8.1 8.1 7.9 Southern side: 7.8 8.2 7.9 7.9 8.1 8.1 Find a 98% confidence interval for the difference in pH between the northern and southern side.arrow_forward
 MATLAB: An Introduction with ApplicationsStatisticsISBN:9781119256830Author:Amos GilatPublisher:John Wiley & Sons Inc
 Probability and Statistics for Engineering and th...StatisticsISBN:9781305251809Author:Jay L. DevorePublisher:Cengage Learning
 Statistics for The Behavioral Sciences (MindTap C...StatisticsISBN:9781305504912Author:Frederick J Gravetter, Larry B. WallnauPublisher:Cengage Learning
 Elementary Statistics: Picturing the World (7th E...StatisticsISBN:9780134683416Author:Ron Larson, Betsy FarberPublisher:PEARSON
 The Basic Practice of StatisticsStatisticsISBN:9781319042578Author:David S. Moore, William I. Notz, Michael A. FlignerPublisher:W. H. Freeman
 Introduction to the Practice of StatisticsStatisticsISBN:9781319013387Author:David S. Moore, George P. McCabe, Bruce A. CraigPublisher:W. H. Freeman