
Concept explainers
Videos
The article “Experimental Measurement of Radiative Heat Transfer in Gas-Solid Suspension Flow System” (G. Han, K. Tuzla. and J. Chen, AIChe Journal, 2002:1910–1916) discusses the calibration of a radiometer. Several measurements were made on the electromotive force readings of the radiometer (in volts) and the radiation flux (in kilowatts per square meter). The results (read from a graph) are presented in the following table.
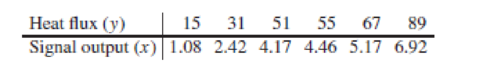
- a. Compute the least-squares line for predicting heat flux from the signal output.
- b. If the radiometer reads 3.00 V, predict the heat flux.
- c. If the radiometer reads 8.00 V, should the heat flux be predicted? If so, predict it. If not, explain why.
Want to see the full answer?
Check out a sample textbook solution
Chapter 7 Solutions
STATISTICS FOR ENGR.+SCI.(LL)-W/ACCESS
Additional Math Textbook Solutions
Basic Business Statistics, Student Value Edition
Elementary Statistics: A Step By Step Approach
Introduction to Statistical Quality Control
Statistics for Business & Economics, Revised (MindTap Course List)
Introductory Statistics
An Introduction to Mathematical Statistics and Its Applications (6th Edition)


- The article in the ASCE Journal of Energy Engineering (1999, Vol. 125, pp.59-75) describes a study of the thermal inertia properties of autoclaved aerated concrete used as a building material. Five samples of the material were tested in a structure, and the average interior temperatures (°C) reported were as follows: 23.01, 22.22, 22.04, 22.62, and 22.59. Test that the average interior temperature is equal to 22.5°C using alpha (a) = 0.05. This problem is a test on what population parameter? What is the null and alternative hypothesis? What are the Significance level and type of test? What standardized test statistic will be used? What is the standard test statistic? What is the Statistical Decision? What is the statistical decision in the statement form?arrow_forwardThe data given is shown below 40 40 43 46 44 49 51 54 46 51 47 49 49 45 45 44 45 41 49 52 51 54 50 51 41 52 53 50 46 56 42 42 40 42 49 47 51 48 46 57 48 55 49 46 57 44 49 43 44 43 51 48 48 46 49 Class width = 6 Find the following: A. Decile (5th) B. Quartile (2nd) C. Skewness D. Kurtosisarrow_forwardThe article “Effect of Varying Solids Concentration and Organic Loading on the Performance of Temperature Phased Anaerobic Digestion Process” (S. Vandenburgh and T. Ellis, Water Environment Research, 2002:142–148) discusses experiments to determine the effect of the solids concentration on the performance of treatment methods for wastewater sludge. In the first experiment, the concentration of solids (in g/L) was 43.94 ± 1.18. In the second experiment, which was independent of the first, the concentration was 48.66 ± 1.76. Estimate the difference in the concentration between the two experiments, and find the uncertainty in the estimate.arrow_forward
- The aging Neotropical termites (Neocapritermes taracua) secrete a sticky, blue-colored liquid that they spew to intruding termites. The younger Neotropical termites secrete a liquid that lacks the blue component, so it is white in appearance. In an experiment that measured the toxicity of the blue substance, the researchers placed one drop of either the blue liquid or the white liquid on individuals of a second termite species, Labiotermes labralis. Of the 41 Labiotermes labralis that got the blue drop, 37 were immobilized. Of the 40 Labiotermes labralis that got the white drop, 9 were immobilized. Is the blue liquid toxic compared to the white liquid?arrow_forwardA consumer buying cooperative tested the effective heating area of 20 different electric space heaters with different wattages. Here are the results. Heater Wattage Area 1 1,000 290 2 750 292 3 1,500 148 4 1,250 246 5 1,250 203 6 750 85 7 1,250 237 8 1,000 139 9 1,500 64 10 1,000 171 11 1,750 163 12 1,250 175 13 750 264 14 1,500 50 15 1,750 163 16 1,500 177 17 1,250 118 18 1,750 122 19 1,000 144 20 1,500 103 Click here for the Excel Data File Compute the correlation between the wattage and heating area. Is there a direct or an indirect relationship? (Round your answer to 4 decimal places.) Conduct a test of hypothesis to determine if it is reasonable that the coefficient is greater than zero. Use the 0.025 significance level. (Round intermediate calculations and final answer to 3 decimal places.) H0: ρ ≤ 0; H1: ρ > 0 Reject H0 if t…arrow_forwardCell Phone Radiation Listed below are the measured radiation absorption rates (in W/kg) corresponding to these cell phones: iPhone 5S, BlackBerry Z30, Sanyo Vero, Optimus V, Droid Razr, Nokia N97, Samsung Vibrant, Sony Z750a, Kyocera Kona, LG G2, and Virgin Mobile Supreme. The data are from the Federal Communications Commission. If one of each model of cell phone is measured for radiation and the results are used to find the measures of variation, are the results typical of the population of cell phones that are in use?arrow_forward
- The Turbine Oil Oxidation Test (TOST) and the Rotating Bomb Oxidation Test (RBOT) are two different procedures for evaluating the oxidation stability of steam turbine oils. An article reported the accompanying observations on x = TOST time (hr) and y = RBOT time (min) for 12 oil specimens. TOST 4200 3600 3750 3650 4050 2770 RBOT 370 345 375 315 350 205 TOST 4870 4525 3450 2700 3750 3325 RBOT 400 380 285 220 345 290 (a) Calculate the value of the sample correlation coefficient. (Round your answer to four decimal places.) r = Carry out a test of hypotheses to decide whether RBOT Time and TOST time are linearly related. (Use ? = 0.05.) Calculate the test statistic and determine the P-value. (Round your test statistic to two decimal places and your P-value to three decimal places.) t = P-value =arrow_forwardSolve An article in the ASCE Journal of Energy Engineering (1999, Vol. 125, pp.59-75) describes a study of the thermal inertia properties of autoclaved aerated concrete used as a building material. Five samples of the material were tested in a structure, and the average interior temperatures (°C) reported were as follows: 23.01, 22.22, 22.04, 22.62, and 22.59. Test that the average interior temperature is equal to 22.5°C using alpha (a) = 0.05. 1.)This problem is a test on what population parameter? a.Variance/ Standard Deviation b.Mean c.Population Proportion d.None of the above 2.)What is the null and alternative 3 points hypothesis? a.Ho / (theta = 22.5) , Ha: (0 # 22.5) b.Ho / (theta > 22.5) , Ha: (0 # 22.5) c.Ho / (theta < 22.5) , Ha: (theta >= 22.5) d.None of the above 3.)What are the Significance level 3 points and type of test? alpha = 0.05 two-tailed alpha = 0.95 two-tailed alpha = 0.95 one-tailed None of the above 4.)What standardized test statistic will…arrow_forwardA consumer buying cooperative tested the effective heating area of 20 different electric space heaters with different wattages. Here are the results. Heater Wattage Area 1 1,000 108 2 750 291 3 1,500 100 4 1,000 43 5 1,250 68 6 1,500 181 7 1,250 254 8 750 228 9 1,500 126 10 1,500 166 11 750 45 12 750 237 13 1,000 75 14 1,750 126 15 1,750 249 16 1,750 105 17 1,750 298 18 1,250 212 19 750 98 20 750 185 Click here for the Excel Data File a. Compute the correlation between the wattage and heating area. Is there a direct or an indirect relationship? (Round your answer to 4 decimal places.) b. Conduct a test of hypothesis to determine if it is reasonable that the coefficient is greater than zero. Use the 0.050 significance level. (Round intermediate calculations and final answer to 3 decimal places.)H0: ρ ≤ 0; H1: ρ > 0 Reject H0 if t > 1.734…arrow_forward
- In the article “Groundwater Electromagnetic Imaging in Complex Geological and Topographical Regions: A Case Study of a Tectonic Boundary in the French Alps” (S. Houtot, P. Tarits, et al., Geophysics, 2002:1048–1060), the pH was measured for several water samples in various locations near Gittaz Lake in the French Alps. The results for 11 locations on the northern side of the lake and for 6 locations on the southern side are as follows: Northern side: 8.1 8.2 8.1 8.2 8.2 7.4 7.3 7.4 8.1 8.1 7.9 Southern side: 7.8 8.2 7.9 7.9 8.1 8.1 Find a 98% confidence interval for the difference in pH between the northern and southern side.arrow_forward1)A new starch polymer foam with high shock absorbent properties is expected to perform better thanthe old foam which can withstand a maximum impact of 1.56 Joule (J). A simple destructive testto quantify shock absorption ability of the new foam is conducted. Table 5 shows the impact energyabsorbed (in J) that the new foam can withstand for each test. Table 51.61 1.5 1.65 1.7 1.4 1.59 1.65 1.5 Does the recorded data suggests that the new foam performs better than the old foam? Use 2.5%level of significance. 2) A number of 28 university students who smokes completed a questionnaire inquiring their smokinghistory and behavior. The result shows that the average smoking initiation age of this group is 21.6years with a variance of 18.49. Based on past record, the smoking initiation age of universitystudent has a mean of 20.74 years with a standard deviation of 5.1 years. Conduct a necessaryanalysis to determine if the smoking initiation age remain the same as the previous record.…arrow_forwardHere is a dataset containing plant growth measurements of plants grown in solutions of commonly-found chemicals in roadway runoff.Phragmites australis, a fast-growing non-native grass common to roadsides and disturbed wetlands of Tidewater Virginia, was grown in a greenhouse and watered with either: Distilled water (control); A weak petroleum solution (representing standard roadway runoff); Sodium chloride solution; Magnesium chloride solution; De-icing brine (50% sodium chloride and 50% magnesium chloride).Twenty grass preparations were used for each solution, and total growth (in cm) was recorded after watering every other day for 40 days.-Perform the correct statistical test to determine the p-value.-Report your answer rounded to four decimal places.-You should use formulas, functions, and the Data Analysis ToolPak in MS Excel to avoid additive rounding errors. Here are some useful functions: =t.test(array1,array2,tails,type) Produces a p-value for any…arrow_forward
 MATLAB: An Introduction with ApplicationsStatisticsISBN:9781119256830Author:Amos GilatPublisher:John Wiley & Sons Inc
 Probability and Statistics for Engineering and th...StatisticsISBN:9781305251809Author:Jay L. DevorePublisher:Cengage Learning
 Statistics for The Behavioral Sciences (MindTap C...StatisticsISBN:9781305504912Author:Frederick J Gravetter, Larry B. WallnauPublisher:Cengage Learning
 Elementary Statistics: Picturing the World (7th E...StatisticsISBN:9780134683416Author:Ron Larson, Betsy FarberPublisher:PEARSON
 The Basic Practice of StatisticsStatisticsISBN:9781319042578Author:David S. Moore, William I. Notz, Michael A. FlignerPublisher:W. H. Freeman
 Introduction to the Practice of StatisticsStatisticsISBN:9781319013387Author:David S. Moore, George P. McCabe, Bruce A. CraigPublisher:W. H. Freeman