
Concept explainers
Videos
(a)
To find: The rabbit population in absence of wolves.
(a)
Answer to Problem 11E
The rabbit population to Stabilize at 5000
Explanation of Solution
Given information:
Let’s modify those equations as follows;
Formula used:
Substitution method is used.
Calculation:
Consider the Lotka - Volterra equations as follows,
If wolves is zero then
One solution is given by R = 0 and W = 0
The other constant solution is R = 5000
Since,
Since
Therefore, the rabbit population to Stabilize at 5000
Conclusion:
The rabbit population to Stabilize at 5000
(b)
To find:the equilibrium solution
(b)
Answer to Problem 11E
The equilibrium population consist of 64 wolves’ 80d 5000 rabbis.
Explanation of Solution
Given information:
Let’s modify those equations as follows;
Formula used:
Substitution method is used.
Calculation:
Both R and W will be constant if both derivatives are zeros, that is
The second equation is true if W = 0 then
If W = 0 in the first equation then R = 0 or
So, the equilibrium population consist of zero wolves and 5000 rabbis.
This means that 1000 rabbits are just enough to support a constant wolf population of zero
If
Then
So, the equilibrium population consist of 64 wolves’ 80d 5000 rabbis.
This means that 1000 rabbits are just enough to support a constant wolf population of 64. There are neither too many wolves (which would result in fewer rabbits) nor too few wolves (which would result in more rabbits)
Conclusion:
The equilibrium population consist of 64 wolves’ 80d 5000 rabbis.
(c)
The population of wolves and rabbits change
(c)
Answer to Problem 11E
The population of wolves and rabbits change 64 and 1000
Explanation of Solution
Given information:
Let’s modify those equations as follows;
Formula used:
Differentiation method is used.
Calculation:
By the part (b) the population of wolves and rabbits change 64 and 1000, respectively and eventually stabilized at those values.
Conclusion:
The population of wolves and rabbits change 64 and 1000
(d)
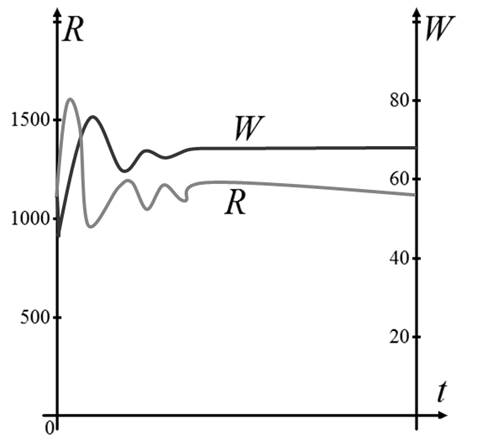
To sketch: the graph of the rabbit and wolf population as function of time.
(d)
Answer to Problem 11E
The graph shows the increases in value.
Explanation of Solution
Given information:
Let’s modify those equations as follows;
Formula used:
The graph is plotted against x axis and y axis.
Calculation:
Sketch the graph of the rabbit and wolf population as function of time.
Conclusion:
The graph shows the increases in value.
Chapter 7 Solutions
Single Variable Calculus: Concepts and Contexts, Enhanced Edition


 Calculus: Early TranscendentalsCalculusISBN:9781285741550Author:James StewartPublisher:Cengage Learning
 Thomas' Calculus (14th Edition)CalculusISBN:9780134438986Author:Joel R. Hass, Christopher E. Heil, Maurice D. WeirPublisher:PEARSON
 Calculus: Early Transcendentals (3rd Edition)CalculusISBN:9780134763644Author:William L. Briggs, Lyle Cochran, Bernard Gillett, Eric SchulzPublisher:PEARSON
 Calculus: Early TranscendentalsCalculusISBN:9781319050740Author:Jon Rogawski, Colin Adams, Robert FranzosaPublisher:W. H. Freeman
 Calculus: Early Transcendental FunctionsCalculusISBN:9781337552516Author:Ron Larson, Bruce H. EdwardsPublisher:Cengage Learning