
Concept explainers
Videos
(a)
To Find: The population change as the time increases.
(a)
Answer to Problem 5E
The population change as the time increases is described.
Explanation of Solution
Given:
The given diagram is shown in Figure 1
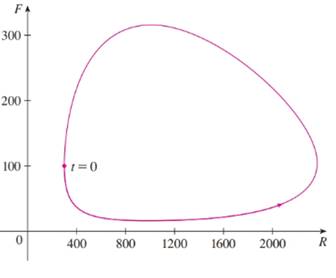
Figure 1
Calculation:
From the given figure the phase trajectory of the graph shows that the rabbit population starts at about 300, increases to value of 2400 and then increase back to 300. Thus, the fox population starts at 100 and it decreases to 20 and then again increases to 315 then back to 100 and then the cycle repeats.
(b)
To Find: The rough sketch of the graphs of R and the function F as the function of time.
(b)
Answer to Problem 5E
The required sketch is shown in Figure 2
Explanation of Solution
Calculation:
The rough sketch of the graph for R and F as the function of time as shown in Figure 2
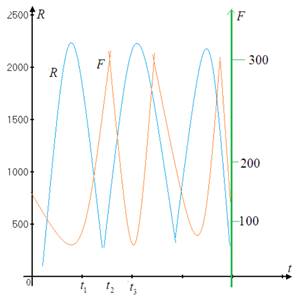
Figure 2
Chapter 7 Solutions
Single Variable Calculus: Concepts and Contexts, Enhanced Edition


 Calculus: Early TranscendentalsCalculusISBN:9781285741550Author:James StewartPublisher:Cengage Learning
 Thomas' Calculus (14th Edition)CalculusISBN:9780134438986Author:Joel R. Hass, Christopher E. Heil, Maurice D. WeirPublisher:PEARSON
 Calculus: Early Transcendentals (3rd Edition)CalculusISBN:9780134763644Author:William L. Briggs, Lyle Cochran, Bernard Gillett, Eric SchulzPublisher:PEARSON
 Calculus: Early TranscendentalsCalculusISBN:9781319050740Author:Jon Rogawski, Colin Adams, Robert FranzosaPublisher:W. H. Freeman
 Calculus: Early Transcendental FunctionsCalculusISBN:9781337552516Author:Ron Larson, Bruce H. EdwardsPublisher:Cengage Learning