
Concept explainers
Videos
(a)
To find: The model predict about the aphids.
(a)
Answer to Problem 12E
In the absence of ladybugs we expect the aphid population to stabilize at 10,000
Explanation of Solution
Given information:
The modelled populations of aphids and ladybugs with a Lotka- Volterra system.
Suppose we modify those equations as follows:
Formula used:
Substitution method is used.
Calculation:
If
So,
Or
Since,
The aphid population to increase to 10,000 for these values of A
Since,
The aphid population to decrease to 10,000 for these values of A
Therefore,in the absence of ladybugs we expect the aphid population to stabilize at 10,000
Conclusion:
In the absence of ladybugs we expect the aphid population to stabilize at 10,000
(b)
To find:The equilibrium solutions.
(b)
Answer to Problem 12E
The equilibrium solution is
(i) L= 0, A= 0 (ii) L= 0, A=10,000 (iii) A=5000, L= 100
Explanation of Solution
Given information:
The populations of aphids and ladybugs with a Lotka- Volterra system.
Suppose the equations as follows:
Formula used:
Calculation:
A and L are constant
The second equation is true if L = 0 or A = 0.5/0.0001 = 5000.
If L = 0 in the first equation, then either A = 0 or A = 1100001 = 10,000.
If A = 5000, then we have that 0 = 5000[2(1 - 0.0001*5000) - 0.01 L]
So the equilibrium solution is
(i) L= 0, A= 0 (ii) L= 0, A=10,000 (iii) A=5000, L= 100
Conclusion:
The equilibrium solution is
(i) L= 0, A= 0 (ii) L= 0, A=10,000 (iii) A=5000, L= 100
(c)
To find: The expression for
(c)
Answer to Problem 12E
The value is
Explanation of Solution
Given information:
The populations of aphids and ladybugs with a Lotka- Volterra system.
Suppose equations as follows:
Formula used:
Calculation:
Conclusion:
The value is
(d)
To find:The phase trajectories being in common.
(d)
Answer to Problem 12E
The entire phase trajectories spiral tightly around the equilibrium solution (5000, 100)
Explanation of Solution
Given information:
The populations of aphids and ladybugs with a Lotka- Volterra system.
Suppose the equations as follows:
Formula used:
The graph is plotted against x axis and y axis.
Calculation:
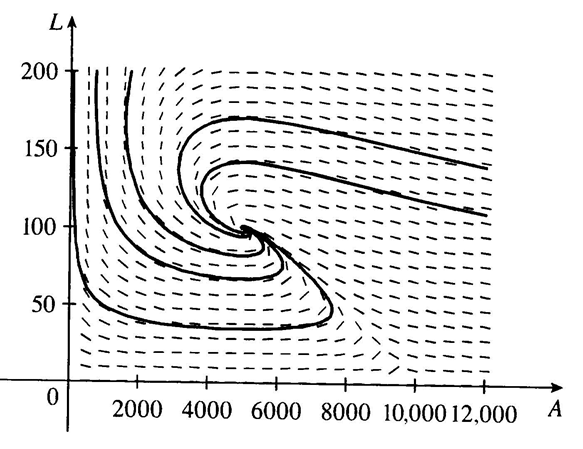
The entire phase trajectories spiral tightly around the equilibrium solution (5000, 100)
Conclusion:
The entire phase trajectories spiral tightly around the equilibrium solution (5000, 100)
(e)
To explain: the population value get changed.
(e)
Answer to Problem 12E
The value get increases and decreases based on the values.
Explanation of Solution
Given information:
The modelled populations of aphids and ladybugs with a Lotka- Volterra system.
Suppose the equation equations as follows:
Formula used:
The graph is plotted against x axis and y axis.
Calculation:
Conclusion:
The value get increases and decreases based on the values.
(f)
To explain: The graph being related to each other.
(f)
Answer to Problem 12E
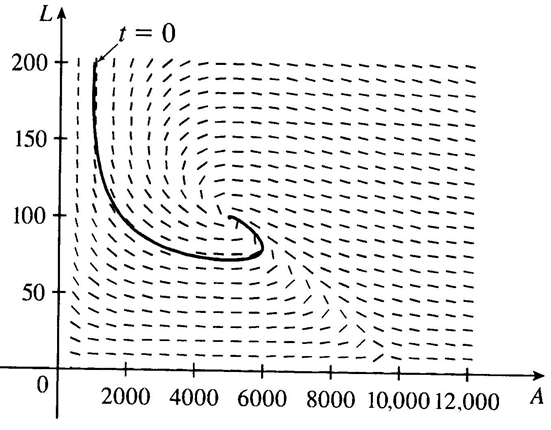
The ladybug population starts to increase and quickly stabilizes at 100, while the aphid population stabilizes at 5000
Explanation of Solution
Given information:
The populations of aphids and ladybugs with a Lotka- Volterra system.
Suppose the equations as follows:
Formula used:
Substitution method is used.
Calculation:
At t = 0, the ladybug population decreases rapidly and the aphid population decreases slightly before beginning to increase. As the aphid population continues to increase, the ladybug population reaches a minimum at about (5000, 75). The ladybug population starts to increase and quickly stabilizes at 100, while the aphid population stabilizes at 5000.
Conclusion:
The ladybug population starts to increase and quickly stabilizes at 100, while the aphid population stabilizes at 5000
(f)
To explain: The graph being related to each other.
(f)
Answer to Problem 12E
The graph of A peaks just after the graph of L has a minimum.
Explanation of Solution
Given information:
Use pan (e) to make rough sketches of the aphid and ladybug populations as functions of t. How are the graphs related to each other?
Formula used:
The graph is plotted against x axis and y axis.
Calculation:
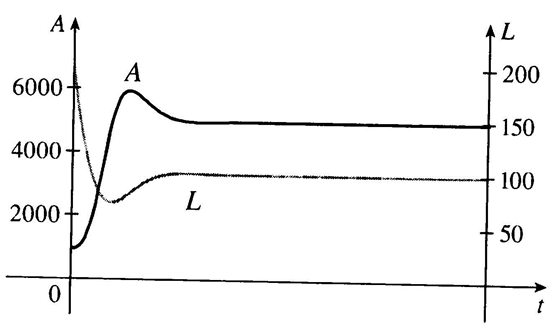
The graph of A peaks just after the graph of L has a minimum.
Conclusion:
The graph of A peaks just after the graph of L has a minimum.
Chapter 7 Solutions
Single Variable Calculus: Concepts and Contexts, Enhanced Edition


 Calculus: Early TranscendentalsCalculusISBN:9781285741550Author:James StewartPublisher:Cengage Learning
 Thomas' Calculus (14th Edition)CalculusISBN:9780134438986Author:Joel R. Hass, Christopher E. Heil, Maurice D. WeirPublisher:PEARSON
 Calculus: Early Transcendentals (3rd Edition)CalculusISBN:9780134763644Author:William L. Briggs, Lyle Cochran, Bernard Gillett, Eric SchulzPublisher:PEARSON
 Calculus: Early TranscendentalsCalculusISBN:9781319050740Author:Jon Rogawski, Colin Adams, Robert FranzosaPublisher:W. H. Freeman
 Calculus: Early Transcendental FunctionsCalculusISBN:9781337552516Author:Ron Larson, Bruce H. EdwardsPublisher:Cengage Learning