
Mathematical Statistics with Applications
7th Edition
ISBN: 9780495110811
Author: Dennis Wackerly, William Mendenhall, Richard L. Scheaffer
Publisher: Cengage Learning
expand_more
expand_more
format_list_bulleted
Videos
Textbook Question
Chapter 8, Problem 106SE
In a controlled pollination study involving Phlox drummondii, a spring-flowering annual plant common along roadsides in sandy fields in central Texas, Karen Pittman and Donald Levin17 found that seed survival rates were not affected by water or nutrition deprivation. In the experiment, flowers on plants were identified as males when they donated pollen and as females when they were pollinated by donor pollen in three treatment groups: control, low water, and low nutrient. The data in the following table reflect one aspect of the findings of the experiment: the number of seeds surviving to maturity for each of the three groups for both male and female parents.
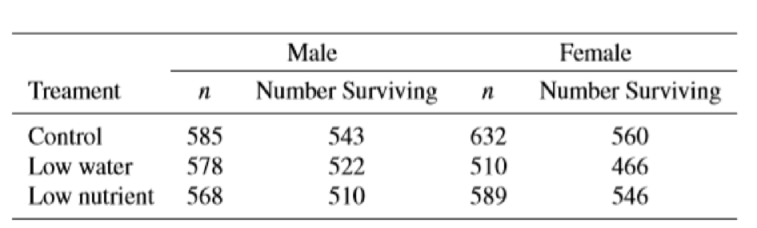
- a Find a 99% confidence interval for the difference between survival proportions in the low-water group versus the low-nutrient group for male parents.
- b Find a 99% confidence interval for the difference between survival proportions in male and female parents subjected to low water.
Expert Solution & Answer

Trending nowThis is a popular solution!

Students have asked these similar questions
An automotive engineer is investigating two different types of metering devices for an electronic fuel injection system to determine whether they differ in their fuel mileage performance. The system is installed on 10 different cars, and a test is run with each metering device on each car. The data is provided below:
Metering Device
Car
1
2
1
17.6
16.8
2
19.4
20.0
3
18.2
17.6
4
17.1
16.4
5
15.3
16.0
6
15.9
15.9
7
16.3
16.5
8
18.0
18.4
9
17.3
16.4
10
19.1
20.1
Is there a significant difference between the means of the two metering devices? Use . Interpret the result in the context of the problem.
An article in the journal Hazardous Waste and Hazardous Materials (Vol. 6, 1989) reported the results of an analysis of the weight of calcium in standard cement and cement doped with lead. Reduced levels of calcium would indicate that the hydration mechanism in the cement is blocked…
Reviewers from the Oregon Evidence-Based Practice Center at the Oregon Health and Science University investigated the effectiveness of prescription drugs in assisting people to fall asleep and stay asleep (source: S. Carson, M.S. McDonagh, et al., “Drug class review: Newer drugs for insomnia,” Oregon Health and Science University, 2008, http://www.ncbi.nlm.nih.gov). Suppose a study of two drugs, Sonata and Ambien, was conducted and the resulting data are contained in a file titled Shuteye. The samples reflect an experiment in which individuals were randomly given the two brands of pills on separate evenings. Their time spent sleeping was recorded for each of the brands of sleeping pills.
(A) Does the experiment seem to have dependent or independent samples? Explain your reasoning.
(B) Do the data indicate that there is a statistical difference in the mean time spent sleeping for people using the two drugs? Test using alpha = 0.02. Conduct a statistical procedure to determine this.
(C)…
Suppose that, as part of a research methods class, Bailey was asked to write a summary of a research paper on the topic of the effects of oil contamination in soil on seed germination rates.
Identify the explanatory and the response variables.
Chapter 8 Solutions
Mathematical Statistics with Applications
Ch. 8.2 - Using the identity ()=[E()]+[E()]=[E()]+B(), Show...Ch. 8.2 - a. If is an unbiased estimator for , what is B()?...Ch. 8.2 - Suppose that is an estimator for a parameter and...Ch. 8.2 - Refer to Exercise 8.1. a. If is an unbiased...Ch. 8.2 - Refer to Exercises 8.1 and consider the unbiased...Ch. 8.2 - Suppose that E(1)=E(2)=, V(1)=12, and V(2)=22....Ch. 8.2 - Consider the situation described in Exercise 8.6....Ch. 8.2 - Suppose that Y1, Y2, Y3 denote a random sample...Ch. 8.2 - Suppose that Y1, Y2,, Yn constitute a random...Ch. 8.2 - The number of breakdowns per week for a type of...
Ch. 8.2 - Let Y1, Y2, , Yn denote a random sample of size n...Ch. 8.2 - The reading on a voltage meter connected to a test...Ch. 8.2 - We have seen that if Y has a binomial distribution...Ch. 8.2 - Prob. 14ECh. 8.2 - Let Y, Y2,,Yn denote a random sample of size n...Ch. 8.2 - Suppose that Y1, Y2,,Yn constitute a random sample...Ch. 8.2 - If Y has a binomial distribution with parameters n...Ch. 8.2 - Let Y1, Y2, , Yn denote a random sample of size n...Ch. 8.2 - Prob. 19ECh. 8.2 - Suppose that Y1, Y2, Y3, Y4 denote a random sample...Ch. 8.4 - An investigator is interested in the possibility...Ch. 8.4 - An increase in the rate of consumer savings...Ch. 8.4 - The Environmental Protection Agency and the...Ch. 8.4 - A study was conducted to compare the mean number...Ch. 8.4 - The Mars twin rovers, Spirit and Opportunity,...Ch. 8.4 - A random sample of 985 likely votersthose who are...Ch. 8.4 - In a study of the relationship between birth order...Ch. 8.4 - Sometimes surveys provide interesting information...Ch. 8.4 - Refer to Exercise 8.29. Give the point estimate...Ch. 8.4 - In a study to compare the perceived effects of two...Ch. 8.4 - An auditor randomly samples 20 accounts receivable...Ch. 8.4 - Refer to Exercise 8.32. From the data given on the...Ch. 8.4 - We can place a 2-standard-deviation bound on the...Ch. 8.4 - Prob. 35ECh. 8.4 - Prob. 36ECh. 8.4 - Refer to Exercise 8.36. An engineer observes n =...Ch. 8.4 - Prob. 38ECh. 8.5 - Suppose that the random variable Y has a gamma...Ch. 8.5 - Suppose that the random variable Y is an...Ch. 8.5 - Suppose that Y is normally distributed with mean 0...Ch. 8.5 - Prob. 42ECh. 8.5 - Prob. 43ECh. 8.5 - Let Y have probability density function...Ch. 8.5 - Refer to Exercise 8.44. a Use the pivotal quantity...Ch. 8.5 - Refer to Example 8.4 and suppose that Y is a...Ch. 8.5 - Refer to Exercise 8.46. Assume that Y1, Y2, , Yn...Ch. 8.5 - Prob. 48ECh. 8.6 - Refer to Example 8.8. In this example, p1 and p2...Ch. 8.6 - Prob. 51ECh. 8.6 - Prob. 52ECh. 8.6 - Prob. 53ECh. 8.6 - Prob. 54ECh. 8.6 - Prob. 55ECh. 8.6 - Is Americas romance with movies on the wane? In a...Ch. 8.6 - Refer to Exercise 8.29. According to the result...Ch. 8.6 - The administrators for a hospital wished to...Ch. 8.6 - When it comes to advertising, tweens are not ready...Ch. 8.6 - What is the normal body temperature for healthy...Ch. 8.6 - A small amount of the trace element selenium, from...Ch. 8.6 - The following statistics are the result of an...Ch. 8.6 - Most Americans love participating in or at least...Ch. 8.6 - In a CNN/USA Today/Gallup Poll, 1000 Americans...Ch. 8.6 - For a comparison of the rates of defectives...Ch. 8.6 - Historically, biology has been taught through...Ch. 8.6 - One suggested method for solving the...Ch. 8.6 - Prob. 68ECh. 8.6 - Prob. 69ECh. 8.7 - Let Y be a binomial random variable with parameter...Ch. 8.7 - A state wildlife service wants to estimate the...Ch. 8.7 - Telephone pollsters often interview between 1000...Ch. 8.7 - Refer to Exercise 8.59. How many tweens should...Ch. 8.7 - Prob. 74ECh. 8.7 - Prob. 75ECh. 8.7 - Refer to the comparison of the daily adult intake...Ch. 8.7 - Prob. 77ECh. 8.7 - Refer to Exercise 8.65. How many items should be...Ch. 8.7 - Refer to Exercise 8.66. a Another similar study is...Ch. 8.8 - Although there are many treatments for bulimia...Ch. 8.8 - The carapace lengths of ten lobsters examined in a...Ch. 8.8 - Scholastic Assessment Test (SAT) scores, which...Ch. 8.8 - Chronic anterior compartment syndrome is a...Ch. 8.8 - Organic chemists often purify organic compounds by...Ch. 8.8 - Two new drugs were given to patients with...Ch. 8.8 - The Environmental Protection Agency (EPA) has...Ch. 8.8 - Refer to Exercise 8.88. Another common...Ch. 8.8 - Do SAT scores for high school students differ...Ch. 8.8 - Seasonal ranges (in hectares) for alligators were...Ch. 8.8 - Solid copper produced by sintering (heating...Ch. 8.8 - Prob. 93ECh. 8.8 - Suppose that we obtain independent samples of...Ch. 8.9 - The EPA has set a maximum noise level for heavy...Ch. 8.9 - In Exercise 8.81, we gave the carapace lengths of...Ch. 8.9 - Suppose that S2 is the sample variance based on a...Ch. 8.9 - Prob. 98ECh. 8.9 - Prob. 99ECh. 8.9 - Industrial light bulbs should have a mean life...Ch. 8.9 - In laboratory work, it is desirable to run careful...Ch. 8.9 - The ages of a random sample of live university...Ch. 8.9 - A precision instrument is guaranteed to read...Ch. 8 - Prob. 104SECh. 8 - Prob. 105SECh. 8 - In a controlled pollination study involving Phlox...Ch. 8 - Prob. 107SECh. 8 - Prob. 108SECh. 8 - To estimate the proportion of unemployed workers...Ch. 8 - Prob. 110SECh. 8 - Prob. 111SECh. 8 - Prob. 112SECh. 8 - Prob. 113SECh. 8 - Prob. 114SECh. 8 - Prob. 115SECh. 8 - Do we lose our memory capacity as we get older? In...Ch. 8 - Prob. 117SECh. 8 - Prob. 118SECh. 8 - Prob. 119SECh. 8 - Two methods for teaching reading were applied to...Ch. 8 - Prob. 121SECh. 8 - Prob. 122SECh. 8 - Prob. 123SECh. 8 - Prob. 124SECh. 8 - Prob. 125SECh. 8 - Prob. 126SECh. 8 - Prob. 127SECh. 8 - Prob. 128SECh. 8 - Prob. 129SECh. 8 - Prob. 130SECh. 8 - Refer to Exercises 1.129 and 1.130. S2 and S2 are...Ch. 8 - Prob. 132SECh. 8 - Prob. 133SECh. 8 - Prob. 134SECh. 8 - Prob. 135SECh. 8 - Prob. 136SE
Knowledge Booster


Learn more about
Need a deep-dive on the concept behind this application? Look no further. Learn more about this topic, statistics and related others by exploring similar questions and additional content below.Similar questions
- The article “Effects of Diets with Whole Plant-Origin Proteins Added with Different Ratiosof Taurine:Methionine on the Growth, Macrophage Activity and Antioxidant Capacity ofRainbow Trout (Oncorhynchus mykiss) Fingerlings” (O. Hernandez, L. Hernandez, et al.,Veterinary and Animal Science, 2017:4-9) reports that a sample of 210 juvenile rainbowtrout fed a diet fortified with equal amounts of the amino acids taurine and methionine for aperiod of 70 days had a mean weight gain of 313 percent with a standard deviation of 25, while 210 fish fed with a control diet had a mean weight gain of 233 percent with a standard deviation of 19. Units are percent. Find a 99% confidence interval for the difference in weight gain on the two diets.arrow_forwardIn its January 25, 2012, issue, the Journal of the American Medical Association reported on the effects of overconsumption of low, normal, and high protein diets on weight gain, energy expenditure, and body composition. Researchers conducted a single blind, randomized controlled trial of 25 U.S. adults. The subjects were healthy, weight-stable, male and female volunteers, aged 18 to 35 years. All subjects consumed a weight-stabilizing diet for 13 to 25 days. Afterwards, the researchers randomly assigned participants to diets containing various percentages of energy from protein: 5% (low protein), 15% (normal protein), or 25% (high protein). The subjects were not aware of the specific protein level diet to which they were assigned. On these diets the researchers overfed the participants during the last 8 weeks of their 10 to 12 week stay in the inpatient metabolic unit. The goal was to investigate the effect of overconsumption of protein on weight gain, energy expenditure, and body…arrow_forwardIn the book Business Research Methods (5th ed.), Donald R. Cooper and C. William Emory discuss studying the relationship between on-the-job accidents and smoking. Cooper and Emory describe the study as follows: Suppose a manager implementing a smoke-free workplace policy is interested in whether smoking affects worker accidents. Since the company has complete reports of on-the-job accidents, she draws a sample of names of workers who were involved in accidents during the last year. A similar sample from among workers who had no reported accidents in the last year is drawn. She interviews members of both groups to determine if they are smokers or not. The sample results are given in the following table. On-the-Job Accident Smoker Yes No Row Total Heavy 12 5 17 Moderate 9 10 19 Nonsmoker 13 17 30 Column total 34 32 66 Expected counts are below observed counts Accident No Accident Total Heavy 12 5 17 8.76 8.24…arrow_forward
- Does posting calorie content for menu items affectpeople’s choices in fast-food restaurants? According to results obtained by Elbel, Gyamfi, and Kersh(2011), the answer is no. The researchers monitoredthe calorie content of food purchases for children andadolescents in four large fast-food chains before andafter mandatory labeling began in New York City. Although most of the adolescents reported noticing thecalorie labels, apparently the labels had no effect ontheir choices. Data similar to the results obtained showan average of M = 786 calories per meal with s =85 for n =100 children and adolescents before thelabeling, compared to an average of M = 772 calorieswith s = 91 for a similar sample of n = 100 after themandatory posting.a. Use a two-tailed test with a = .05 to determinewhether the mean number of calories after theposting is significantly different than before caloriecontent was posted.b. Calculate r2to measure effect size for the mean difference.arrow_forwardThe manager of a company that assembles and exports a particular type of pumps wants to know if there is a link between the number of hours spent by assembly workers in training and their productivity on the job. A random sample of 7 assembly workers was selected and their performances evaluated. The summary of the obtained data is listed in Table 2. Table 2: Shows the time spend by workers during training and their productivity on jobTraining hours (x) 20 36 20 38 40 33 32Output (y) 40 70 44 56 60 48 62 (i) Construct a scatter plot of the sample data and comment on the relationship between hours of training and output. (ii) Estimate a simple regression line, using the method of least squares, to identify a linear relationship between the hours of training received by assembly workers and their output (i.e. number of units assembled per day). (iii) Interpret, in context, the gradient/slope of the regression line. (iv) Estimated the output at 20 hours training time. (v) Interpret the…arrow_forwardA U.S. study published in The American Journal of Preventive Medicine compared state-level prevalence of firearm ownership in 2002 with state-level rates of firearm assault and firearm robbery in the subsequent year. The investigators found a positive association - meaning that states with higher prevalence of firearm ownership also tended to be the states with higher rates of firearm assault. Which design best describes this study? a)Observational cohort study b)Randomized trial c)Case-control study d)Ecological studyarrow_forward
- A low-level CDC bureaucrat wants to please his boss by gathering evidence thatthe current government-mandated shutdown of society is not causing people’s mentalhealth to deteriorate, so that it can safely be continued for several years if anyexpert says it’s necessary.He polls a random sample of 1600 citizens, gathering data on such items asincome loss, weight gain, access to toilet paper, hours spent binge-watchingNetflix, and number of injuries caused by household fights, and compiles all thisinto a scientifically-weighted “misery index”.The mean misery index from the sample is 99.2; it seems reasonable to use apopulation standard deviation σ = 19.1.a) Does this information provide significant evidence (at the 5% level) that thenationwide mean misery index is less than 100? Set up appropriate null andalternative hypotheses, calculate the appropriate test statistic, find the P-value,and state your conclusion. (10)b) A CDC press release publishing the results of this study claims that…arrow_forwardA low-level CDC bureaucrat wants to please his boss by gathering evidence thatthe current government-mandated shutdown of society is not causing people’s mentalhealth to deteriorate, so that it can safely be continued for several years if anyexpert says it’s necessary.He polls a random sample of 1600 citizens, gathering data on such items asincome loss, weight gain, access to toilet paper, hours spent binge-watchingNetflix, and number of injuries caused by household fights, and compiles all thisinto a scientifically-weighted “misery index”.The mean misery index from the sample is 99.2; it seems reasonable to use apopulation standard deviation σ = 19.1.a) Does this information provide significant evidence (at the 5% level) that thenationwide mean misery index is less than 100? Set up appropriate null andalternative hypotheses, calculate the appropriate test statistic, find the P-value,and state your conclusion. b) A CDC press release publishing the results of this study claims that…arrow_forwardA sociologist wants to investigate the question, "Is there a relationship between texting during class and grade-point-average (GPA) among high school seniors in a large district?" Which study design is most appropriate? Before the semester starts, randomly select 40 seniors from each high school who do not text during class. Assign 20 to the texting treatment group (text three or more times during every class meeting) and 20 to the control group (no texting during class). At the end of the semester, obtain each student’s GPA from the appropriate admissions and records office. Compare the GPA of students who routinely text during class to the GPA of students who do not text during class. Before the semester starts, randomly select 40 seniors from each high school who do not text during class. Assign 20 to the texting treatment group (text three or more times during every class meeting) and 20 to the control group (no texting during class). At the end of the semester,…arrow_forward
- A cross-sectional study is conducted to investigate cardiovascular disease (CVD) risk factors among a sample of patients seeking medical care at one of three local hospitals. A total of 500500 patients are enrolled. Based on the following data, we would like to determine if there is a significant association between the family history of CVD and the enrollment site. Enrollment Site Family History of CVD Hospital 1 Hospital 2 Hospital 3 Total Yes 34 8 58 100 No 104 72 224 400 Total 138 80 282 500 Given: The value of the test statistic is χ2= 6.912 Use α=0.1 as the level of significance. The superintendent of Hospital 2 performed the Goodness of Fit Test to test whether 25% of the patients go to Hospital 1, 15% of the patients go to Hospital 2 and 60% of the patients go to Hospital 3. Given: The superintendent found that the pp-value for the test is 0.25091 Let: p1=p1= be the proportion of patients at Hospital 1 p2=p2= be the proportion of patients at…arrow_forwardBased on a survey of 12,344 U.S. college students and 6,729 Canadian college students, Kuo, Adlaf, Lee, Gliksman, Demers, and Wechsler (2002) report that alcohol use is more common among Canadian than U.S. students, but heavy drinking (five or more drinks in a row for males, four or more for females) is significantly higher among U.S. students than Canadian students. Is this an example of a survey research design?arrow_forwardIn a study conducted in the Science Department of Faculty of Science, Technology and Human Development in a University; the researcher examined the influence of the drug succinylcholine on the circulation levels of androgens in the blood. Blood samples from wild, free-ranging deer were obtained via the jugular vein immediately after an intramuscular injection of succinylcholine using darts and a capture gun. Deer were bled again approximately 30 minutes after the injection and then released. The level of androgens at time of capture and 30 minutes later, measured in nanograms per milliliter (ng/ml), for 15 deers as in Table Q1. Assuming that the populations of androgen at time of injection and 30 minutes later are normally distributed:i) Find the average and standard deviation of this studyii)Determine the critical region of this problem.iii) Test at the 0.05 level of significance whether the androgen concentrations are altered after 30 minutes of restraint.arrow_forward
arrow_back_ios
SEE MORE QUESTIONS
arrow_forward_ios
Recommended textbooks for you
 MATLAB: An Introduction with ApplicationsStatisticsISBN:9781119256830Author:Amos GilatPublisher:John Wiley & Sons Inc
 Probability and Statistics for Engineering and th...StatisticsISBN:9781305251809Author:Jay L. DevorePublisher:Cengage Learning
 Statistics for The Behavioral Sciences (MindTap C...StatisticsISBN:9781305504912Author:Frederick J Gravetter, Larry B. WallnauPublisher:Cengage Learning
 Elementary Statistics: Picturing the World (7th E...StatisticsISBN:9780134683416Author:Ron Larson, Betsy FarberPublisher:PEARSON
 The Basic Practice of StatisticsStatisticsISBN:9781319042578Author:David S. Moore, William I. Notz, Michael A. FlignerPublisher:W. H. Freeman
 Introduction to the Practice of StatisticsStatisticsISBN:9781319013387Author:David S. Moore, George P. McCabe, Bruce A. CraigPublisher:W. H. Freeman
MATLAB: An Introduction with Applications
Statistics
ISBN:9781119256830
Author:Amos Gilat
Publisher:John Wiley & Sons Inc
Probability and Statistics for Engineering and th...
Statistics
ISBN:9781305251809
Author:Jay L. Devore
Publisher:Cengage Learning
Statistics for The Behavioral Sciences (MindTap C...
Statistics
ISBN:9781305504912
Author:Frederick J Gravetter, Larry B. Wallnau
Publisher:Cengage Learning
Elementary Statistics: Picturing the World (7th E...
Statistics
ISBN:9780134683416
Author:Ron Larson, Betsy Farber
Publisher:PEARSON
The Basic Practice of Statistics
Statistics
ISBN:9781319042578
Author:David S. Moore, William I. Notz, Michael A. Fligner
Publisher:W. H. Freeman
Introduction to the Practice of Statistics
Statistics
ISBN:9781319013387
Author:David S. Moore, George P. McCabe, Bruce A. Craig
Publisher:W. H. Freeman
what is Research Design, Research Design Types, and Research Design Methods; Author: Educational Hub;https://www.youtube.com/watch?v=LpmGSioXxdo;License: Standard YouTube License, CC-BY