Horngren's Financial & Managerial Accounting (5th Edition)
5th Edition
ISBN: 9780133866292
Author: Tracie L. Miller-Nobles, Brenda L. Mattison, Ella Mae Matsumura
Publisher: PEARSON
expand_more
expand_more
format_list_bulleted
Videos
Textbook Question
Chapter 8, Problem 8.25E
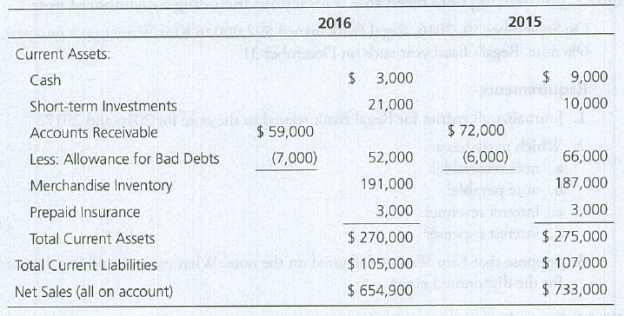
Evaluating ratio data
Chippewa Carpets reported the following amounts in its 2016 financial statements. The 2015 figures are given for comparison.
Requirements
- 1. Calculate Chippewa’s acid-test ratio for 2016. (Round to two decimals.) Determine whether Chippewa’s acid-test ratio improved or deteriorated from 2015 to 2016. How does Chippewa’s acid-test ratio compare with the industry average of 0.80?
- 2. Calculate Chippewa’s accounts receivable turnover ratio. (Round to two decimals.) How does Chippewa’s ratio compare to the industry average accounts receivable turnover of 10?
- 3. Calculate the days’ sales in receivables for 2016. (Round to the nearest day.) How do the results compare with Chippewa’s credit terms of net 30?
Expert Solution & Answer

Trending nowThis is a popular solution!

Students have asked these similar questions
Using the financial statements
provided below for ABC
Manufacturing Company, calculate all the
ratios listed below for both 2020 and2021. Assume that all sales are credit sales.
(a) Calculate the ratios forABC Manufacturing Company for2020 and 2021.
(b)Put an“I/D” beside the Year 2021 ratio calculation if the ratio has Improved/Deteriorated.
Putan“S”/“W” beside the Year 2021 ratio if ABC
Manufacturing Company’s ratio is Stronger/Weake rthan its competitors
Guinea C. Company is preparing trend percentages for its service fees earned for the period 2013 through 2017. The base year is 2013. The 2016 trend percentage is computed as:
Question 23 options:
A)
2016 service fees earned divided by 2012 service fees earned
B)
2015 service fees earned divided by 2016 service fees earned
C)
2016 service fees earned divided by 2013 service fees earned
D)
2013 service fees earned divided by 2016 service fees earned
Compare Delta to two of its competitors, JetBlue and Southwest, by answering the following questions. You do not need to calculate all of the ratios for JetBlue and Southwest, only the ones required to answer the questions below:
How much bigger is Delta from each of its competitors, by Revenue, in each year from 2018-2022? Plot the Revenue number for each company for these years on a single line graph.
Which company has the highest Net Income in each year from 2018-2022?
Which company has the highest Net Profit Margin in 2018? In 2022?
Which company is the most profitable based on Gross Profit percentage each year from 2018-2022? (This is a trick question.)
Which company is best at using its short-term assets to pay off its short-term liabilities in 2019? Which company has the best cash ratio in 2019? Is it the same company that is best at using its short-term assets to pay short-term liabilities? If not, why do you think it's different?
Which company is the most leveraged in 2022?
Chapter 8 Solutions
Horngren's Financial & Managerial Accounting (5th Edition)
Ch. 8 - Prob. 1QCCh. 8 - When recording credit card or debit card sales...Ch. 8 - Which of the following is a limitation of the...Ch. 8 - The entry to record a write-off of an...Ch. 8 - Brickman Corporation uses the allowance method to...Ch. 8 - Brickmans ending balance of Accounts Receivable is...Ch. 8 - At December 31 year-end, Crain Corporation has an...Ch. 8 - Using the data in the preceding question, what...Ch. 8 - At year-end, Schultz, Inc. has cash of 11,600,...Ch. 8 - Using the data in the preceding question, assume...
Ch. 8 - What is the difference between accounts receivable...Ch. 8 - Prob. 2RQCh. 8 - Prob. 3RQCh. 8 - When dealing with receivables, give an example of...Ch. 8 - What type of account must the sum of all...Ch. 8 - Prob. 6RQCh. 8 - What are two common methods used when accepting...Ch. 8 - What occurs when a business factors its...Ch. 8 - What occurs when a business pledges its...Ch. 8 - Prob. 10RQCh. 8 - Prob. 11RQCh. 8 - Prob. 12RQCh. 8 - Prob. 13RQCh. 8 - When using the allowance method, how are accounts...Ch. 8 - Prob. 15RQCh. 8 - Prob. 16RQCh. 8 - How does the percent- of-sales method compute bad...Ch. 8 - How do the percent-of-receivables and aging-of-...Ch. 8 - What is the difference between the...Ch. 8 - Prob. 20RQCh. 8 - Prob. 21RQCh. 8 - Prob. 22RQCh. 8 - Prob. 23RQCh. 8 - Prob. 24RQCh. 8 - Prob. 8.1SECh. 8 - Prob. 8.2SECh. 8 - Applying the direct write-off method to account...Ch. 8 - Collecting a receivable previously written...Ch. 8 - Prob. 8.5SECh. 8 - Applying the allowance method (percent-of-sales)...Ch. 8 - Applying the allowance method...Ch. 8 - Prob. 8.8SECh. 8 - Prob. 8.9SECh. 8 - Accounting for a note receivable On June 6,...Ch. 8 - Prob. 8.11SECh. 8 - Recording a dishonored note receivable Midway...Ch. 8 - Prob. 8.13SECh. 8 - Defining common receivables terms Match the terms...Ch. 8 - Prob. 8.15ECh. 8 - Journalizing transactions using the direct...Ch. 8 - Use the following information to answer Exercises...Ch. 8 - Use the following information to answer Exercises...Ch. 8 - Accounting for uncollectible accounts using the...Ch. 8 - Journalizing transactions using the direct...Ch. 8 - Journalizing credit card sales, note receivable...Ch. 8 - Journalizing note receivable transactions...Ch. 8 - Journalizing note receivable transactions The...Ch. 8 - Journalizing note receivable transactions Like New...Ch. 8 - Evaluating ratio data Chippewa Carpets reported...Ch. 8 - Prob. 8.26ECh. 8 - Prob. 8.27APCh. 8 - Accounting for uncollectible accounts using the...Ch. 8 - Accounting for uncollectible accounts using the...Ch. 8 - Accounting for uncollectible accounts...Ch. 8 - Accounting for notes receivable and accruing...Ch. 8 - Accounting for notes receivable, dishonored notes,...Ch. 8 - Using ratio data to evaluate a companys financial...Ch. 8 - Prob. 8.34BPCh. 8 - Prob. 8.35BPCh. 8 - Accounting for uncollectible accounts using the...Ch. 8 - Accounting for uncollectible accounts...Ch. 8 - Accounting for notes receivable and accruing...Ch. 8 - Accounting for notes receivable, dishonored notes,...Ch. 8 - Prob. 8.40BPCh. 8 - Prob. 8.41CPCh. 8 - Prob. 8.42PSCh. 8 - Prob. 8.1CTDCCh. 8 - Paulines Pottery has always used the direct...Ch. 8 - Prob. 8.1CTFCCh. 8 - Use Starbucks Corporations Fiscal 2013 Annual...
Knowledge Booster


Learn more about
Need a deep-dive on the concept behind this application? Look no further. Learn more about this topic, accounting and related others by exploring similar questions and additional content below.Similar questions
- Refer to the following mentioned data. Net sales Cost of products sold Gross margin 2017 2016 2015 Required: a. Calculate the gross profit ratio for each of the past three years. (Round your answers to 2 decimal places.) (In millions) 2016 2017 2015 $34,894 $30,411 $26,113 14,318 13,376 13,767 $20,576 $17,035 $12,346 Cost of goods sold Gross profit 58.94 % % % b. Assume that Campbell's net sales for the first four months of 2018 totaled $12.79 billion. Calculate an estimated cost of goods sold and gross profit for the four months, using the gross profit ratio for 2017. (Round Intermediate calculations to 2 decimal places. Enter your answers in millions rounded to nearest whole number (1.e., 5,000,000 should be entered as 5).) million millionarrow_forwardWhat is the comparison (analysis) of the Days Sales Outstanding of Industry Average Ratio and the Company A Ratio? The Days Sales Outstanding has decreased and increased. Why? Industry Average DSO 2015: 138 days 2016: 104 days 2017: 173 days 2018: 125 days 2019: 98 days Company A DSO 2015: 245 days 2016: 338 days 2017: 332 days 2018: 169 days 2019: 81 daysarrow_forwardRequired: Use an Excel file to answer the following questions. Compute the following ratios for the companies’ 2014 fiscal years. (Use formulas): Current ratio Average days to sell inventory. (Use average inventory.) Debt to assets ratio. Return on investment. (Use average assets and use “earnings from continuing operations” rather than “net earnings.”) Gross margin percentage. Asset turnover. (Use average assets.) Net margin. (Use “earnings from continuing operations” rather than “net earnings.”) Plant assets to long-term debt ratio. Which company appears to be more profitable? Explain your answer and identify which ratio(s) from Requirement a you used to reach your conclusion. Which company appears to have the higher level of financial risk? Explain your answer and identify which ratio(s) from Requirement a you used to reach your conclusion. Which company appears to be charging higher prices for its goods? Explain your answer and identify which ratio(s) from Requirement a you…arrow_forward
- Compare the resulting ratios of P and P Manufacturing Company for 2018 (per your computation) with its competitors in the table given below.arrow_forwardThis problem is based on the 2017 annual report of Campbell Soup Company. Answer the following questions. Refer to the Selected Financial Data for parts (a) to (d).Required: Find the net sales in 2014. (Enter your answer in millions.) Calculate the operating income (earnings before interest and taxes) in 2013. (Enter your answer in millions.) Calculate the difference between operating income (earnings before interest and taxes) and net income (net earnings) in 2015. (Enter your answer in millions.) Find the year(s) in which net income (net earnings) decreased compared to the previous year. attatched are the charts needed for the following questions, I have tried to figure these out but I come up with incorrect answers. Thank Youarrow_forwardRefer to the following mentioned data. Net sales Cost of products sold Gross margin (In millions) 2017 2016 $34,954 $30, 040 14,274 13, 395 $20, 680 $16, 645 2017 2016 2015 Required: a. Calculate the gross profit ratio for each of the past three years. (Round your answers to 2 decimal places.) 2015 $26, 091 13, 655 $12, 436 59.16 % 55.41 % 47.66 %arrow_forward
- Revenue and expense data for the current calendar year for Tannenhill Company and for the electronics industry are as follows. Tannenhill’s data are expressed in dollars. The electronics industry averages are expressed in percentages. Please see the attachment for details: a. Prepare a common-sized income statement comparing the results of operations for Tannenhill Company with the industry average. Round to the nearest whole percentage.b. As far as the data permit, comment on significant relationships revealed by the comparisons.arrow_forwardOperating data for Flounder Corp. are presented below. 2017 2016 Sales revenue $825,400 $628,400 Cost of goods sold 527,300 412,700 Selling expenses 125,600 76,800 Administrative expenses 75,500 52,800 Income tax expense 36,700 29,200 Net income 60,300 56,900 Prepare a schedule showing a vertical analysis for 2017 and 2016. (Round percentages to 1 decimal place, e.g. 12.1%.)arrow_forward10. Review the select information for Bean Superstore and Legumes Plus (industry competitors), and then complete the following. A. Compute the accounts receivable turnover ratios for each company for 2018 and 2019. B. Compute the number of days' sales in receivables ratios for each company for 2018 and 2019. C. Determine which company is the better investment and why. Round answers to two decimal places. BEAN SUPERSTORE LEGUMES PLUS Comparative Balance Sheet December 31, 2017, 2018, and 2019 Comparative Balance Sheet December 31, 2017, 2018, and 2019 2019 2018 2017 2019 2018 2017 Assets Cash $345,600 67,000 145,830 100,465 $330,460 62,000 178,011 101,202 $300,000 59,000 155,205 103,085 $407,000 85,430 128,080 182,006 $386,450 82,670 40,036 23,400 $356,367 79,230 52,142 111,701 Accounts Receivable Inventory Equipment Total Assets $658,895 $671,673 $617,290 $802,516 $532,556 $599,440 Liabilities Salaries Payable Accounts Payable Notes Payable $ 91,455 $ 90,200 70,000 41,000 $ 88,563…arrow_forward
- Computing and Interpreting Financial Statement Ratios Following are selected ratios of Norfolk Southern for 2018 and 2017. Return on Assets (ROA) Component 2018 2017 Profitability (Net income/Sales) 25.3% 53.2% Productivity (Sales/Average assets) 0.338 0.319 a. Was the company profitable in 2018?Answer b. Was the company more profitable in 2018 or 2017?Answer c. Is the change in productivity a positive or negative development?Answer d. Compute the company’s ROA for 2018 and for 2017. Note: Round answers to one decimal places (example: 10.4%). ROA 2018 Answer 2017 Answer e. From the information provided, which of the following best explains the change in ROA during 2018? Answerarrow_forwardAn analyst is evaluating the profi tability of Daimler AG (Xetra: DAI) over a recentfi ve-year period. He gathers the following revenue data and calculates the followingprofi tability ratios from information in Daimler’s annual reports:2009 2008 2007 2006 2005Revenues (€ millions) 78,924 98,469 101,569 99,222 95,209Gross profi t margin 16.92% 21.89% 23.62% 20.60% 19.48%Operating profi t (EBIT) margin a–1.92% 2.77% 8.58% 5.03% 3.02%Pretax margin –2.91% 2.84% 9.04% 4.94% 2.55%Net profi t margin –3.35% 1.73% 4.78% 3.19% 2.37%aEBIT (Earnings before interest and taxes) is the operating profi t metric used by Daimler.Daimler’s revenue declined from 2007 to 2008 and from 2008 to 2009. Further,Daimler’s 2009 revenues were the lowest of the fi ve years. Management’s discussion ofthe decline in revenue and EBIT in the 2009 Annual Report notes the following:Th e main reason for the decline [in EBIT] was a signifi cant drop in revenuedue to markedly lower unit sales in all vehicle segments as a…arrow_forwardFollowing are 2017 and 2018 revenue data for Honeywell International's four segments. Use these data to forecast its 2019 revenue. Note: Complete the entire question using the following Excel template: Excel Template. Then enter the answers into the provided spaces below with two decimal places. Honeywell International Segment Sales and Business-Unit Sales by Segment $ millions 2018 2017 Aerospace sales Commercial aviation original equipment Commercial aviation aftermarket Defense and space Transportation systems Total aerospace sales Honeywell building technologies sales Homes Buildings Total Honeywell building technologies sales Performance materials and technologies sales UOP Russell LLP Process solutions Advanced materials Total performance materials and technologies sales $3,591 $2,475 5,373 5,861 5,423 4,053 2,622 3,906 $17,009 $16,295 $4,686 $4,482 5,370 6,053 $10,056 $10,535 $3,603 $2,753 4,981 5,553 3,606 2,791 $12,190 $11,097 Safety and productivity solutions sales Safety…arrow_forward
arrow_back_ios
SEE MORE QUESTIONS
arrow_forward_ios
Recommended textbooks for you
 Cornerstones of Financial AccountingAccountingISBN:9781337690881Author:Jay Rich, Jeff JonesPublisher:Cengage Learning
Cornerstones of Financial Accounting
Accounting
ISBN:9781337690881
Author:Jay Rich, Jeff Jones
Publisher:Cengage Learning
How To Analyze an Income Statement; Author: Daniel Pronk;https://www.youtube.com/watch?v=uVHGgSXtQmE;License: Standard Youtube License