
Concept explainers
Videos
For Exercises 1 through 20, perform each of the following steps.
a. State the hypotheses and identify the claim.
b. Find the critical value(s).
c. Compute the test value.
d. Make the decision.
e. Summarize the results.
Use the traditional method of hypothesis testing unless otherwise specified.
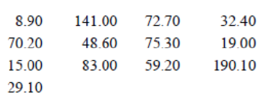
6. Trifecta Winnings A random sample of $1 Trifecta tickets at a local racetrack paid the following amounts (in dollars and cents). Is there sufficient evidence to conclude that the average Trifecta winnings exceed $50? Use α = 0.10. Assume the variable is
Want to see the full answer?
Check out a sample textbook solution
Chapter 8 Solutions
Elementary Statistics: A Step By Step Approach
Additional Math Textbook Solutions
PRACTICE OF STATISTICS F/AP EXAM
An Introduction to Mathematical Statistics and Its Applications (6th Edition)
Business Analytics
Statistics for Business & Economics, Revised (MindTap Course List)
STATISTICS F/BUSINESS+ECONOMICS-TEXT


- You are working for the South Tahoe Tourist Bureau and are interested in determining if there is a relationship between the casino people frequent and the type of gambling that they do at the casino Table Games Slots Sports Harrah’s 50 60 12 Hard Rock 18 22 6 MontBleu 33 29 20 Harvey’s 41 39 20 a. State the null and alternative hypotheses. b. State which hypothesis test should be used. Calculate the p-Value and state the command you entered in the calculator. c. State the conclusion in the context of the problem.arrow_forwardUse the 7 steps in Hypothesis Testing in answering the problems below.arrow_forwardGiven that the P-value for the hypothesis test is 0.501, what do you conclude? Does it appear that the heights were obtained through measurement or that the subjects reported their heights?arrow_forward
- You are given the following hypotheses: H0: p = 0.3HA: p ≠ 0.3 We know that the sample size is 90. For what sample proportion would the p-value be equal to 0.1? Assume that all conditions necessary for inference are satisfied.arrow_forwardname the appropriate inference procedure, and write the hypotheses. DO NOT ACTUALLY WORK OUT THESE FIRST 4 PROBLEMS. there are 2 bacteria this chart applies to both Specimen 1 2 3 4 5 6 7 8 Method A 22.7 23.6 24.0 27.1 27.4 27.8 34.4 35.2 B 23.0 23.1 23.7 26.5 26.6 27.1 33.2 35.0 Bacteria 1 Investigators at the U.S. Department of Agriculture wished to compare methods of determining the level of bacterial contamination in beef. Two different methods (A and B) of determining the level of contamination were used on each of eight randomly selected specimens of a certain type of beef. The data obtained, in millimicrobes/liter of ground beef, for each of the methods are shown in the table below. Bacteria 2 Investigators at the U.S. Department of Agriculture wished to compare methods of determining the level of bacterial contamination in beef. Two different methods (A and B) of determining the level of contamination were tested. Sixteen randomly selected specimens of a certain type…arrow_forwardUse the five steps in the hypothesis testing procedure for each answer. 1 ) A national publishing house claims that 45% of all weekly magazine readers in South Africa read their publication. Test this claim at the 5% significance level, if a survey found that 205 out of a random sample of 500 magazine readers said that they read the relevant publication.arrow_forward
- Fill in the table with the correct answers. Specify the (a) hypotheses, (b) appropriate test statistic, (c) rejection region, (d) identify if CLT is applicable or not in the following situations.arrow_forwardUse the five steps in the hypothesis testing procedure for each answer The CEO of a large financial institution claims that, on average, their clientsinvest more than R150 000 per year in a particular portfolio. Test this claim atthe 10% significance level if it was found that a sample of 25 clients invested an average of R145 000 in the portfolio over the last year, with a standarddeviation of R15 000.arrow_forwardThe proportion of mango trees on an island that produce only dwarf fruit is p1. The proportion of mango trees on a different island that produce only dwarf fruit is p2. What is the null hypothesis for a test to determine if the proportions are different between the two islands? Select the correct answer below: H0: p1−p2≠0 H0: p1−p2=0 H0: p1−p2>0 H0: p1−p2<0arrow_forward
- If the proportion of the population in City A that is over 65 years old is p1 and the proportion of the population in City B that is over 65 years old is p2, what is the null hypothesis for a test to determine if the proportion of the population that is over 65 years old is greater in City A? Select the correct answer below: H0: p1−p2=0 H0: p1−p2>0 H0: p1−p2<0 H0: p1−p2≠0arrow_forwardThe P-value for a hypothesis test is P = 0.034. Do you reject or fail to reject H 0 when the level of significance is α = 0.01?arrow_forwardWrite the following five steps of hypothesis test: 1. Set a set of hypotheses 2. Determine rejection rule with a given a (Fa). 3. Compute test statistic (F-Value) 4. Make judgment 5. Interpretation with p-value Utilize excel output to conduct your answers.arrow_forward
 MATLAB: An Introduction with ApplicationsStatisticsISBN:9781119256830Author:Amos GilatPublisher:John Wiley & Sons Inc
 Probability and Statistics for Engineering and th...StatisticsISBN:9781305251809Author:Jay L. DevorePublisher:Cengage Learning
 Statistics for The Behavioral Sciences (MindTap C...StatisticsISBN:9781305504912Author:Frederick J Gravetter, Larry B. WallnauPublisher:Cengage Learning
 Elementary Statistics: Picturing the World (7th E...StatisticsISBN:9780134683416Author:Ron Larson, Betsy FarberPublisher:PEARSON
 The Basic Practice of StatisticsStatisticsISBN:9781319042578Author:David S. Moore, William I. Notz, Michael A. FlignerPublisher:W. H. Freeman
 Introduction to the Practice of StatisticsStatisticsISBN:9781319013387Author:David S. Moore, George P. McCabe, Bruce A. CraigPublisher:W. H. Freeman