
Videos
Find the critical value (or values) for the t test for each.
a. n = 12, α = 0.01, left-tailed
b. n = 16, α = 0.05, right-tailed
c. n = 7, α = 0.10, two-tailed
d. n = 11, α = 0.025, right-tailed
e. n = 10, α = 0.05, two-tailed
a.
To find: The critical value for t test when
Answer to Problem 3E
The critical value is –2.718.
Explanation of Solution
Given info:
The sample size is,
Calculation:
Degrees of freedom:
Software Procedure:
Step-by-step procedure to obtain the critical value using the MINITAB software:
- Choose Graph > Probability Distribution Plot choose View Probability > OK.
- From Distribution, choose ‘t’ distribution.
- In Degrees of freedom, enter 11.
- Click the Shaded Area tab.
- Choose Probability Value and Left Tail for the region of the curve to shade.
- Enter the Probability value as 0.01.
- Click OK.
Output using the MINITAB software is given below:
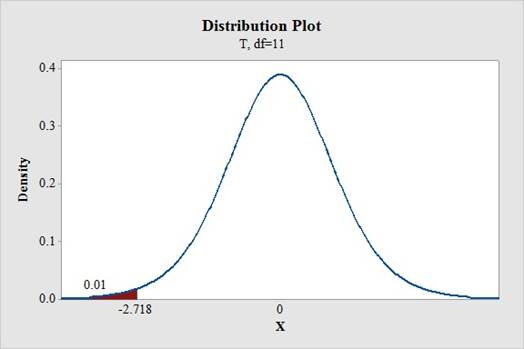
From the output, the critical value is –2.718.
b.
To find: The critical value for t test when
Answer to Problem 3E
The critical value is +1.753.
Explanation of Solution
Given info:
The sample size is,
Calculation:
Degrees of freedom:
Software Procedure:
Step-by-step procedure to obtain the critical value using the MINITAB software:
- Choose Graph > Probability Distribution Plot choose View Probability > OK.
- From Distribution, choose ‘t’ distribution.
- In Degrees of freedom, enter 15.
- Click the Shaded Area tab.
- Choose Probability Value and Right Tail for the region of the curve to shade.
- Enter the Probability value as 0.05.
- Click OK.
Output using the MINITAB software is given below:
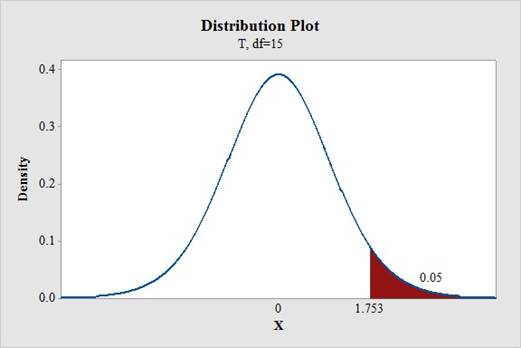
From the output, the critical value is +1.753.
c.
To find: The critical value for t test when
Answer to Problem 3E
The critical value is ±1.943.
Explanation of Solution
Given info:
The sample size is,
Calculation:
Degrees of freedom:
Software Procedure:
Step-by-step procedure to obtain the critical value using the MINITAB software:
- Choose Graph > Probability Distribution Plot choose View Probability > OK.
- From Distribution, choose ‘t’ distribution.
- In Degrees of freedom, enter 16.
- Click the Shaded Area tab.
- Choose Probability Value and Two Tail for the region of the curve to shade.
- Enter the Probability value as 0.10.
- Click OK.
Output using the MINITAB software is given below:
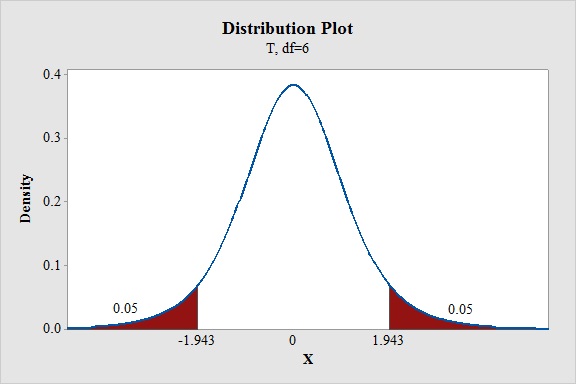
From the output, the critical value is ±1.943.
d.
To find: The critical value for t test when
Answer to Problem 3E
The critical value is +2.228.
Explanation of Solution
Given info:
The sample size is,
Calculation:
Degrees of freedom:
Software Procedure:
Step-by-step procedure to obtain the critical value using the MINITAB software:
- Choose Graph > Probability Distribution Plot choose View Probability > OK.
- From Distribution, choose ‘t’ distribution.
- In Degrees of freedom, enter 10.
- Click the Shaded Area tab.
- Choose Probability Value and Right Tail for the region of the curve to shade.
- Enter the Probability value as 0.025.
- Click OK.
Output using the MINITAB software is given below:
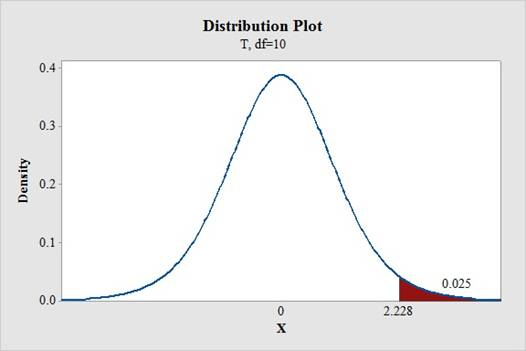
From the output, the critical value is +2.228.
e.
To find: The critical value for t test when
Answer to Problem 3E
The critical value is ±2.262.
Explanation of Solution
Given info:
The sample size is,
Calculation:
Degrees of freedom:
Software Procedure:
Step-by-step procedure to obtain the critical value using the MINITAB software:
- Choose Graph > Probability Distribution Plot choose View Probability > OK.
- From Distribution, choose ‘t’ distribution.
- In Degrees of freedom, enter 9.
- Click the Shaded Area tab.
- Choose Probability Value and Two Tail for the region of the curve to shade.
- Enter the Probability value as 0.05.
- Click OK.
Output using the MINITAB software is given below:
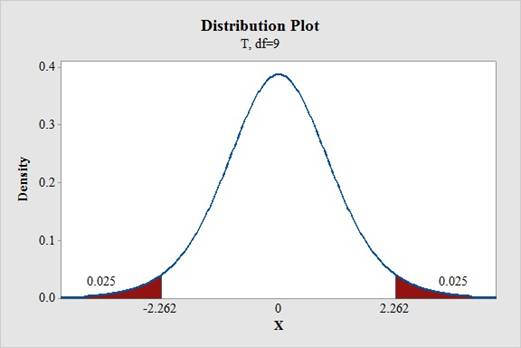
From the output, the critical value is ±2.262.
Want to see more full solutions like this?
Chapter 8 Solutions
Elementary Statistics: A Step By Step Approach


- 2. The critical value of t is 1.383, the value of the test statistic t = -1.383; therefore, we do not reject H0 a. True b. Falsearrow_forwardIf the t values in the table for a t-test are ± 2.15 at alpha level 0.05, which of following computed t value is needed in order to reject the null hypothesis? Group of answer choices – 2.35 – 1.35 1.35 2.1arrow_forward. In general, a ____ t-statistic and a _____ p-value (relative to a chosen critical value and alpha) indicate that our estimated statistic is ____ to occur by chance if the null is true. a. Large; large; likely b. Small; large; likely c. Small; small; unlikely d. Large; large; likelyarrow_forward
- The critical value for t for n = 10 for a one tail test at α = 5% LOS isarrow_forwardIf, in a sample of n=20 selected from a normal population, X=59and S=12, what are the critical values of t if the level of significance, α, is 0.05, the null hypothesis, H0, is μ=50, and the alternative hypothesis, H1, is μ≠50? The critical values of t arearrow_forwardFind the critical value, z0, from the z table for the given parameters. a=0.10 left tailed testarrow_forward
- If you let X1, X2, X3, X4 equal the cholesterol level of a woman under the age of 50, a man under 50, a woman 50 or older, and a man 50 or older, respectively. Assuming the distribution of Xi is N(μi, σ2), i = 1, 2, 3, 4 and you test the null hypothesis H0: μ1 = μ2 = μ3 = μ4, using seven observations of each Xi, what would be the critical region for an alpha = 0.05 significance level?arrow_forwardThe critical value for the T test for n=10, a=0.05, one tailed is?arrow_forwardA researcher obtains t=2.25 for a repeated measures study using a sample of n=10 participants. Based on this t value, what is the correct decision for a two- tail test at .05 and .01 alpha level?arrow_forward
- Find the critical value (or values) for the t test for each. • n = 10, α = 0.05, right-tailed • n = 18, α = 0.10, two-tailed • n = 28, α = 0.01, left-tailed • n = 25, α = 0.01, two-tailedarrow_forwardFind the critical value, z0, from the z table for the given parameters. a=0.20 two tailed testarrow_forwardGrant, of Black by Dezign!, was trying the find the the critical values (t-scores) for the following. Alpha in the left tail is 2.5%, sample size is 27. α is 20% and the degrees of freedom are twenty-four. 0.5%, df= 19 and s = 28 years. (Right tail) α is 5% and the sample size is 10.arrow_forward
 MATLAB: An Introduction with ApplicationsStatisticsISBN:9781119256830Author:Amos GilatPublisher:John Wiley & Sons Inc
 Probability and Statistics for Engineering and th...StatisticsISBN:9781305251809Author:Jay L. DevorePublisher:Cengage Learning
 Statistics for The Behavioral Sciences (MindTap C...StatisticsISBN:9781305504912Author:Frederick J Gravetter, Larry B. WallnauPublisher:Cengage Learning
 Elementary Statistics: Picturing the World (7th E...StatisticsISBN:9780134683416Author:Ron Larson, Betsy FarberPublisher:PEARSON
 The Basic Practice of StatisticsStatisticsISBN:9781319042578Author:David S. Moore, William I. Notz, Michael A. FlignerPublisher:W. H. Freeman
 Introduction to the Practice of StatisticsStatisticsISBN:9781319013387Author:David S. Moore, George P. McCabe, Bruce A. CraigPublisher:W. H. Freeman