
Concept explainers
Videos
For Exercises 1 through 25, perform each of the following steps.
a. State the hypotheses and identify the claim.
b. Find the critical value(s).
c. Compute the test value.
d. Make the decision.
e. Summarize the results.
Use diagrams to show the critical region (or regions), and use the traditional method of hypothesis testing unless otherwise specified.
3. Revenue of Large Businesses A researcher estimates that the average revenue of the largest businesses in the United States is greater than $24 billion. A random sample of 50 companies is selected, and the revenues (in billions of dollars) are shown. At α = 0.05, is there enough evidence to support the researcher’s claim? Assume σ = 28.7.
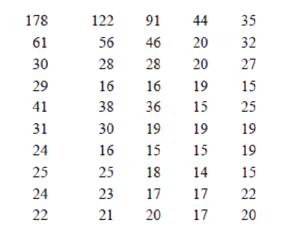
Source: New York Times Almanac.
Want to see the full answer?
Check out a sample textbook solution
Chapter 8 Solutions
Elementary Statistics: A Step By Step Approach


- A dental assistant is interested in the proportion of patients that need a root canal. Let the proportion of patients that need a root canal be p. If the dental assistant wanted to know if the proportion of patients that need a root canal is more than 20%, what are the null and alternative hypotheses? Select the correct answer below: H0: p=0.20; Ha: p<0.20 H0: p>0.20; Ha: p=0.20 H0: p=0.20; Ha: p>0.20 H0: μ=0.20; Ha: μ>0.20arrow_forwardState the null and alternative hypotheses to be used in testing the following claims also explain type of test.(a) At most, 20% of next year’s wheat crop will be exported to the Soviet Union.(b) On the average, American homemakers drink 3 cups of coffee per day.(c) The proportion of college graduates in Virginia this year who majored in the social sciences is at least 0.15.(d) The average donation to the American Lung Association is no more than $10.(e) Residents in suburban Richmond commute, on the average, 15 kilometers to their place of employmentarrow_forwardFollow the steps in testing hypothesis to answer the problem:arrow_forward
- Brown wants to conduct an assessment of where employees live and how employees work. Brown wanted to know if where you lived was related to how you worked. What hypothesis tests can be used in this case?arrow_forwardIf the proportion of the population in City A that is over 65 years old is p1 and the proportion of the population in City B that is over 65 years old is p2, what is the null hypothesis for a test to determine if the proportion of the population that is over 65 years old is greater in City A? Select the correct answer below: H0: p1−p2=0 H0: p1−p2>0 H0: p1−p2<0 H0: p1−p2≠0arrow_forwardDetermine which of the following statements are true about the critical region. The critical region is a term used when the null hypothesis is rejected. The critical region is comprised of extreme sample values that are very unlikely to be obtained if the alternative hypothesis is true. The critical regions is determined by the alpha level. The critical region is comprised of extreme samples values that are very unlikely to be obtained if the null hypothesis is truearrow_forward
- If an original claim for some aspect of a population is u=3.00, the test statistics is t= +2.05 and the critical values are CV= -1.90, +1.90, would you reject or fail to reject the null hypothesis? (Pick one and justify your answer)arrow_forwardYou are working for the South Tahoe Tourist Bureau and are interested in determining if there is a relationship between the casino people frequent and the type of gambling that they do at the casino Table Games Slots Sports Harrah’s 50 60 12 Hard Rock 18 22 6 MontBleu 33 29 20 Harvey’s 41 39 20 a. State the null and alternative hypotheses. b. State which hypothesis test should be used. Calculate the p-Value and state the command you entered in the calculator. c. State the conclusion in the context of the problem.arrow_forwardYou are given the following hypotheses H 0 :p=0.3 H A :p not equal 0.3 We know that the sample size 90. For what sample proportion would the pvalue be equal to 0.1? Assume that all conditions necessary for Inference are satisfied.arrow_forward
- Based on the data and Anova table, complete the parts of hypothesis testing Ho: ? Ha: ? Alpha: 0.05 F: 6.31 Condition: When to reject Ho? Conclusion?arrow_forwardMaria has two routes, E and W, she can take when commuting to work. Both routes go through a railroad crossing, and sometimes she needs to stop at the crossing to allow trains to pass. She claims that the proportion of times she needs to stop when taking route E is different from the proportion of times she needs to stop when taking route W. She conducted the following hypothesis test at the significance level of α=0.10. H0:pE=pWHa:pE≠pW In the hypotheses, pE represents the proportion of times she needs to stop at the crossing when using route E, and pWrepresents the proportion of times she needs to stop at the crossing when using route W. All conditions for inference were met, and the resulting p-value was 0.37. Which of the following is the correct decision for the test? The p-value is less than α, and the null hypothesis is rejected. There is convincing evidence to support the claim that the proportion of times she needs to stop at the crossing is different for the…arrow_forwardThe proportion of mango trees on an island that produce only dwarf fruit is p1. The proportion of mango trees on a different island that produce only dwarf fruit is p2. What is the null hypothesis for a test to determine if the proportions are different between the two islands? Select the correct answer below: H0: p1−p2≠0 H0: p1−p2=0 H0: p1−p2>0 H0: p1−p2<0arrow_forward
 MATLAB: An Introduction with ApplicationsStatisticsISBN:9781119256830Author:Amos GilatPublisher:John Wiley & Sons Inc
 Probability and Statistics for Engineering and th...StatisticsISBN:9781305251809Author:Jay L. DevorePublisher:Cengage Learning
 Statistics for The Behavioral Sciences (MindTap C...StatisticsISBN:9781305504912Author:Frederick J Gravetter, Larry B. WallnauPublisher:Cengage Learning
 Elementary Statistics: Picturing the World (7th E...StatisticsISBN:9780134683416Author:Ron Larson, Betsy FarberPublisher:PEARSON
 The Basic Practice of StatisticsStatisticsISBN:9781319042578Author:David S. Moore, William I. Notz, Michael A. FlignerPublisher:W. H. Freeman
 Introduction to the Practice of StatisticsStatisticsISBN:9781319013387Author:David S. Moore, George P. McCabe, Bruce A. CraigPublisher:W. H. Freeman