
Videos
Testing the Difference Between Two Means in Exercises 13–22, (a) identify the claim and state H0 and Ha, (b) find the critical value(s) and identify the rejection region(s), (c) find the standardized test statistic t, (d) decide whether to reject or fail to reject the null hypothesis, and (e) interpret the decision in the context of the original claim. Assume the samples are random and independent, and the populations are
 22. Teaching Methods Two teaching methods and their effects on science test scores are being reviewed. A group of students is taught in traditional lab sessions. A second group of students is taught using interactive simulation software. The science test scores for the two groups are shown in the back-to-back stem-and-leaf plot.
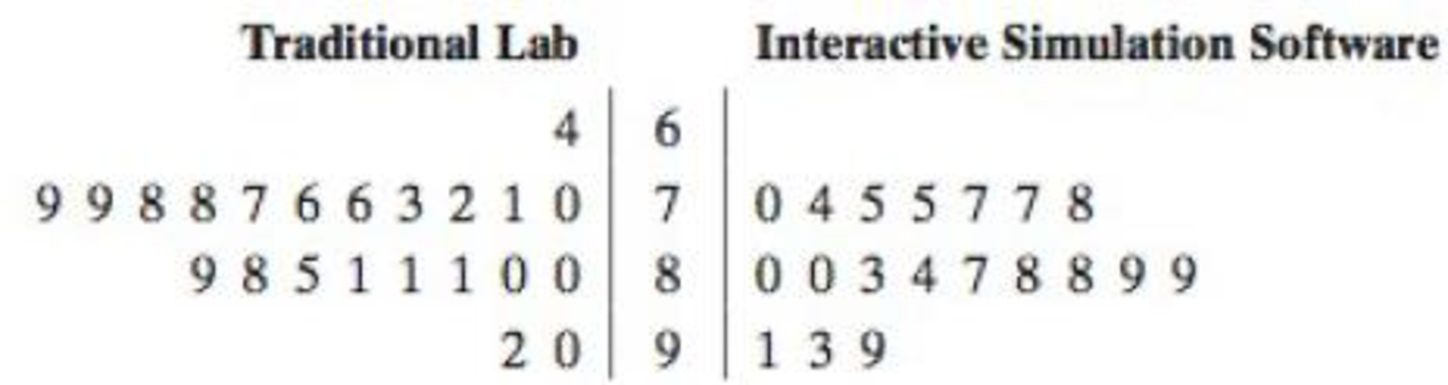
Key: 0|9|1 = 90 for traditional and 91 for interactive
At α = 0.01, can you support the claim that the
Want to see the full answer?
Check out a sample textbook solution
Chapter 8 Solutions
Elementary Statistics: Picturing the World (7th Edition)


- Testing Hypotheses. In Exercises 13–24, assume that a simple random sample has been selected and test the given claim. Unless specified by your instructor, use either the P-value method or the critical value method for testing hypotheses. Identify the null and alternative hypotheses, test statistic, P-value (or range of P-values), or critical value(s), and state the final conclusion that addresses the original claim. Car Booster Seats The National Highway Traffic Safety Administration conducted crash tests of child booster seats for cars. Listed below are results from those tests, with the measurements given in hic (standard head injury condition units). The safety requirement is that the hic measurement should be less than 1000 hic. Use a 0.01 significance level to test the claim that the sample is from a population with a mean less than 1000 hic. Do the results suggest that all of the child booster seats meet the specified requirement?arrow_forwardTesting Claims About Variation. In Exercises 5–16, test the given claim. Identify the null hypothesis, alternative hypothesis, test statistic, P-value, or critical value(s), then state the conclusion about the null hypothesis, as well as the final conclusion that addresses the original claim. Assume that a simple random sample is selected from a normally distributed population. Aircraft Altimeters The Skytek Avionics company uses a new production method to manufacture aircraft altimeters. A simple random sample of new altimeters resulted in the errors listed below. Use a 0.05 level of significance to test the claim that the new production method has errors with a standard deviation greater than 32.2 ft, which was the standard deviation for the old production method. If it appears that the standard deviation is greater, does the new production method appear to be better or worse than the old method? Should the company take any action?arrow_forwardTesting Claims About Variation. In Exercises 5–16, test the given claim. Identify the null hypothesis, alternative hypothesis, test statistic, P-value, or critical value(s), then state the conclusion about the null hypothesis, as well as the final conclusion that addresses the original claim. Assume that a simple random sample is selected from a normally distributed population. Pulse Rates of Women Repeat the preceding exercise using the pulse rates of women listed in Data Set 1 “Body Data” in Appendix B. For the sample of pulse rates of women, n = 147 and s = 12.5. See the accompanying JMP display that results from using the original list of pulse rates instead of the summary statistics. (Hint: The bottom three rows of the display provide P -values for a two-tailed test, a left-tailed test, and a right-tailed test, respectively.) What do the results indicate about the effectiveness of using the range rule of thumb with the “normal range” from 60 to 100 beats per minute for estimating…arrow_forward
 Functions and Change: A Modeling Approach to Coll...AlgebraISBN:9781337111348Author:Bruce Crauder, Benny Evans, Alan NoellPublisher:Cengage Learning