
Videos
In Exercises 23 and 24, (a) identify the claim and state H0 and Hα, (b) find the critical value(s) and identify the rejection region(s), (c) calculate
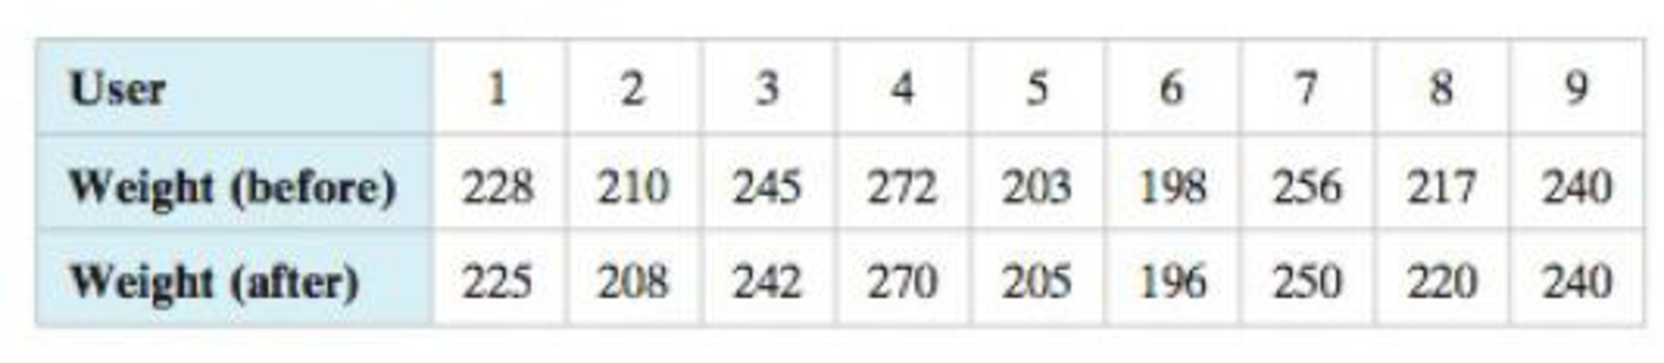
24. A physical fitness instructor claims that a weight loss supplement will help users lose weight after two weeks. The table shows the weights (in pounds) of 9 adults before using the supplement and two weeks after using the supplement. At α = 0.10, is there enough evidence to support the physical fitness instructor’s claim?
Want to see the full answer?
Check out a sample textbook solution
Chapter 8 Solutions
Elementary Statistics: Picturing the World (7th Edition)


- Test the claim that the proportion of people who own cats is smaller than 50% at the 0.01 significance level.The null and alternative hypothesis would be: H0:p≥0.5H0:p≥0.5Ha:p<0.5Ha:p<0.5 H0:μ=0.5H0:μ=0.5Ha:μ≠0.5Ha:μ≠0.5 H0:μ≤0.5H0:μ≤0.5Ha:μ>0.5Ha:μ>0.5 H0:p≤0.5H0:p≤0.5Ha:p>0.5Ha:p>0.5 H0:p=0.5H0:p=0.5Ha:p≠0.5Ha:p≠0.5 H0:μ≥0.5H0:μ≥0.5Ha:μ<0.5Ha:μ<0.5 The test is: left-tailed two-tailed right-tailed Based on a sample of 100 people, 49% owned catsThe test statistic is: (Round to 2 decimals)The p-value is: (Round to 2 decimals)Based on this we:arrow_forwardUsing the z table (Table E), find the critical value (or values) for each of the following significance levels in conducting a hypothesis test. 0.01, left-tailed test 0.10, two-tailed test. 0.01, right-tailed test. 0.04, left-tailed test 0.02, right-tailed test 0.02, two-tailed testarrow_forwardIn a study of a group of women science majors who remained in their profession and a group who left their profession within a few months of graduation, the researchers collected the data shown here on a self-esteem questionnaire. Leavers Stayers1 = 3.05 2 = 2.92σ1 = 0.71 σ2 = 0.71n1 = 100 n2 = 227At α = 0.05, can it be concluded that there is a difference in the self-esteem scores of the two groups? Use the P-value method.arrow_forward
- Test the claim that the proportion of people who own cats is smaller than 50% at the 0.025 significance level.The null and alternative hypothesis would be: H0:p≤0.5H0:p≤0.5Ha:p>0.5Ha:p>0.5 H0:μ≥0.5H0:μ≥0.5Ha:μ<0.5Ha:μ<0.5 H0:p=0.5H0:p=0.5Ha:p≠0.5Ha:p≠0.5 H0:p≥0.5H0:p≥0.5Ha:p<0.5Ha:p<0.5 H0:μ=0.5H0:μ=0.5Ha:μ≠0.5Ha:μ≠0.5 H0:μ≤0.5H0:μ≤0.5Ha:μ>0.5Ha:μ>0.5 The test is: right-tailed two-tailed left-tailed Based on a sample of 700 people, 43% owned catsThe test statistic is: (Round to 2 decimals)The p-value is: (Round to 2 decimals)Based on this we: Reject the null hypothesis Do not reject the null hypothesisarrow_forwardTest the claim that the proportion of people who own cats is smaller than 20% at the 0.005 significance level.The null and alternative hypothesis would be: Select One ______ H0:p≤0.2H0:p≤0.2Ha:p>0.2Ha:p>0.2 _______H0:μ≥0.2H0:μ≥0.2Ha:μ<0.2Ha:μ<0.2 _____H0:μ=0.2H0:μ=0.2Ha:μ≠0.2Ha:μ≠0.2 ______H0:p=0.2H0:p=0.2Ha:p≠0.2Ha:p≠0.2 _______H0:p≥0.2H0:p≥0.2Ha:p<0.2Ha:p<0.2 ______H0:μ≤0.2H0:μ≤0.2Ha:μ>0.2Ha:μ>0.2 The test is: Select One ___two-tailed ___left-tailed ___right-tailed Based on a sample of 600 people, 19% owned catsThe test statistic is: __?__ (Round to 2 decimals)The p-value is: __?__ (Round to 2 decimals)arrow_forwardA consumer group is investigating a producer of diet meals to examine if its prepackaged meals actually contain the advertised 6 ounces of protein in each package. Assume the weights of all the prepackaged meals are normally distributed. Based on the following data, is there any evidence that the meals do not contain the advertised amount of protein? Run the appropriate test at a 5% level of significance. A. What are the appropriate hypotheses? B. What is the critical value(s) of the test? C. What is the test statistic? D. What is the decision rule using the critical values? E. What is the p-value of the test? G. What is your decision?arrow_forward
- Test the null hypothesis H0 : β1 = β2 against the alternative H1 : β1 < β2 at 1% significance level.arrow_forward3. A researcher is testing a two-tailed null hypothesis at the p < .01 level with df = 45. What critical value would she or he use? Justify your answerarrow_forwardIn a random sample of 110 voters, the proportion of voters in favor of a bond issue is 0.8. Let p = proportion of all voters who are in favor of the bond issue. (1) Test H0:p≤0.65 against H1:p>0.65. Use α=0.05. The test statistic is The critical value is The final conclustion is A. There is not sufficient evidence to reject the null hypothesis that p≤0.65. B. We can reject the null hypothesis that p≤0.65 and accept that p>0.65. (2) Test H0:p≥0.5 against H1:p<0.5. Use α=0.05. The test statistic is The critical value is The final conclustion is A. There is not sufficient evidence to reject the null hypothesis that p≥0.5. B. We can reject the null hypothesis that p≥0.5 and accept that p<0.5. (3) Test H0:p=0.55 against H1:p≠0.55. Use α=0.01. The test statistic is The positive critical value is The negative critical value is The final conclustion is A. We can reject the null hypothesis that p=0.55 and accept that p≠0.55. B. There is not sufficient evidence…arrow_forward
- Test the claim that the proportion of people who own cats is smaller than 60% at the 0.005 significance level.The null and alternative hypothesis would be: H0:μ=0.6H0:μ=0.6H1:μ≠0.6H1:μ≠0.6 H0:p=0.6H0:p=0.6H1:p≠0.6H1:p≠0.6 H0:p≤0.6H0:p≤0.6H1:p>0.6H1:p>0.6 H0:μ≥0.6H0:μ≥0.6H1:μ<0.6H1:μ<0.6 H0:p≥0.6H0:p≥0.6H1:p<0.6H1:p<0.6 H0:μ≤0.6H0:μ≤0.6H1:μ>0.6H1:μ>0.6 The test is: two-tailed right-tailed left-tailed Based on a sample of 200 people, 51% owned catsThe test statistic is: (to 2 decimals)The p-value is: (to 2 decimals)Based on this we: Reject the null hypothesis Fail to reject the null hypothesisarrow_forwardThe contingency table shows how a random sample of college freshmen graded the leaders of three types of institutions. α=0.05, Institution A B C D/FMilitary 23 47 15 23Religious 21 42 28 19Media / Press 18 24 39 24 The claim is ? What are the degrees of freedom? d.f = What is the critical value? What is the test statistic? Should I reject or fail to reject the null hypothesis? What is the correct rejection region?arrow_forwardConduct a test at the α=0.01 level of significance by determining (a) the null and alternative hypotheses, (b) the test statistic, and (c) the P-value. Assume the samples were obtained independently from a large population using simple random sampling. Test whether p1>p2. The sample data are x1=129, n1=241, x2=139, and n2=312. (a) Choose the correct null and alternative hypotheses below. A. H0: p1=p2 versus H1: p1≠p2 B. H0: p1=p2 versus H1: p1>p2 Your answer is correct. C. H0: p1=p2 versus H1: p1<p2 D. H0: p1=0 versus H1: p1≠0 (b) Determine the test statistic. z0= (Round to two decimal places as needed.) Pvalue = (Round to three decimal places as needed.arrow_forward
 MATLAB: An Introduction with ApplicationsStatisticsISBN:9781119256830Author:Amos GilatPublisher:John Wiley & Sons Inc
 Probability and Statistics for Engineering and th...StatisticsISBN:9781305251809Author:Jay L. DevorePublisher:Cengage Learning
 Statistics for The Behavioral Sciences (MindTap C...StatisticsISBN:9781305504912Author:Frederick J Gravetter, Larry B. WallnauPublisher:Cengage Learning
 Elementary Statistics: Picturing the World (7th E...StatisticsISBN:9780134683416Author:Ron Larson, Betsy FarberPublisher:PEARSON
 The Basic Practice of StatisticsStatisticsISBN:9781319042578Author:David S. Moore, William I. Notz, Michael A. FlignerPublisher:W. H. Freeman
 Introduction to the Practice of StatisticsStatisticsISBN:9781319013387Author:David S. Moore, George P. McCabe, Bruce A. CraigPublisher:W. H. Freeman