Understandable Statistics: Concepts and Methods
12th Edition
ISBN: 9781337119917
Author: Charles Henry Brase, Corrinne Pellillo Brase
Publisher: Cengage Learning
bartleby

Concept explainers

bartleby

Videos

Question
Book Icon
Chapter 8.2, Problem 22P

(i)

To determine

Check the sample mean by using the calculator.

Check the sample standard deviation by using the calculator.

(i)

Expert Solution
Check Mark

Explanation of Solution

Calculation:

Let x denotes tree-ring dates in this excavation area.

Mean:

Use Ti 83 calculator to find the mean as follows:

  • Select STAT > Edit > Enter the values of Dates.
  • Click 2nd button; take the arrow to the MATH menu, and then ‘3’ numbered key.
  • Click 2nd button; then ‘1’ numbered key to get L1, and close the ‘)’ bracket.
  • Click Enter.

Output using Ti 83 calculator is given below:

Understandable Statistics: Concepts and Methods, Chapter 8.2, Problem 22P , additional homework tip  1

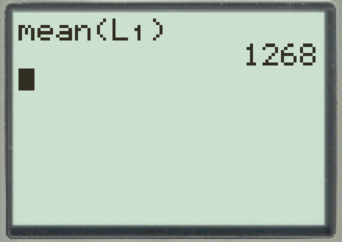
From the Ti 83 calculator output, the mean value is 1268.

Standard deviation:

Use Ti 83 calculator to find the standard deviation as follows:

  • Select STAT > Edit > Enter the values of Dates.
  • Click 2nd button; take the arrow to the MATH menu, and then ‘7’ numbered key.
  • Click 2nd button; then ‘1’ numbered key to get L1, and close the ‘)’ bracket.
  • Click Enter.

Output using Ti 83 calculator is given below:

Understandable Statistics: Concepts and Methods, Chapter 8.2, Problem 22P , additional homework tip  2

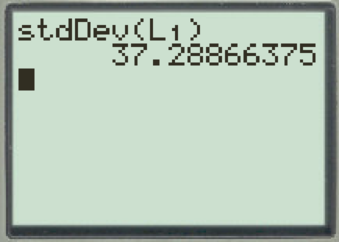
From the Ti 83 calculator output, the standard deviation value is approximately 37.29.

Hence, the sample mean and the sample standard deviation by using the calculator is verified.

(ii)

To determine

(a)

Find the level of significance.

State the null and alternative hypothesis.

(b)

Identify the sampling distribution to be used.

Explain how the sampling distribution is chosen.

Find the sampling distribution value of the sample test statistic.

(c)

Find the P-value.

Draw the sampling distribution by showing the area corresponding to the P-value.

(d)

Check whether the null hypothesis is rejecting or fail to reject.

Identify whether the data statistically significant at level 0.01 or not.

(e)

Interpret the conclusion in the context of the application.

(ii)

Expert Solution
Check Mark

Answer to Problem 22P

(a)

The level of significance is 0.01.

The null hypothesis is H0:μ=1300.

The alternative hypothesis is H1:μ1300.

(b)

The sampling distribution to be used is Student’s t distribution.

The Student’s t distribution is chosen because the x distribution is normal and population standard deviation is not known.

The sampling distribution value of the sample test statistic is –2.714.

(c)

The P-value is 0.0239.

(d)

The null hypothesis is failed to be rejected.

The data is not statistically significant at level 0.01.

Explanation of Solution

Calculation:

(a)

Let μ denotes the mean of tree-ring dates in the area.

From the given information the value of α is 0.01, and the population mean of tree-ring dates in the area is different from that in 1300 A.D.

Hence, the level of significance is 0.01.

The null and alternative hypothesis is,

Null hypothesis:

H0:μ=1300

Alternative hypothesis:

H1:μ1300

(b)

Conditions:

  • When the x distribution considered in the study has the normal distribution with the known population standard deviation σ then the sampling distribution x¯ has normal distribution for any sample size n. The standardized z statistic is used for testing.
  • When the x distribution considered in the study is not normally distributed and the population standard deviation σ is known then the sampling distribution x¯ has normal distribution if the sample size n is greater than or equal 30. That is, n30.

Test statistic for t:

The z statistic value for sample test statistic x¯ is,

t=x¯μ(sn)

In the formula x¯ is sample mean, μ is population mean, σ is sample standard deviation, and n is the sample size.

The distribution of x is assumed to be normal and the population standard deviation is unknown. The x distribution considered in the study is normally distributed and population standard deviation is unknown. Hence, the sampling distribution to be used is Student’s t distribution.

T-statistic:

Substitute x¯ as 1268, μ as 1300, s as 37.29, and n as 10 in the test statistic formula

t=12681300(37.2910)=3211.7921=2.714

Hence, the sampling distribution value of the sample test statistic is –2.714.

(c)

Use Ti 83 calculator to obtain the P-value as follows:

  • Select STAT, take the arrow to the TESTS menu, and then ‘2’ numbered key.
  • Select Stats under Inpt.
  • Enter μ0 as 1300.
  • Enter x¯ as 1268, Sx as 37.29, and n as 10.
  • Select the option μ0 under μ.
  • Click Draw.

Output using Ti 83 calculator is given below:

Understandable Statistics: Concepts and Methods, Chapter 8.2, Problem 22P , additional homework tip  3

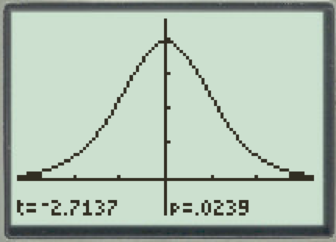
From the Ti 83 calculator output, the P-value is 0.0239.

Hence, the P-value is 0.0239.

(d)

Rejection rule:

  • If the P-value is less than or equal to α, then reject the null hypothesis and the test is statistically significant. That is, P-valueα.

Conclusion:

The P-value is 0.0239 and the level of significance is 0.01.

The P-value is greater than the level of significance.

That is, 0.0239(=P-value)>0.01(=α).

By the rejection rule, the null hypothesis is failed to be rejected.

Hence, the data is not statistically significant at level 0.01.

(e)

The null hypothesis is failed to be rejected. This shows that, the population mean of tree-ring dates in the area is not different from that in 1300 A.D at level of significance 0.05.

Want to see more full solutions like this?

Subscribe now to access step-by-step solutions to millions of textbook problems written by subject matter experts!
Students have asked these similar questions
Answer the Following Questions for no. 1 and show your clear solutions: A. Getting statistic from a parameter of 800, sampling error of 1% and largest possible proportion of 50%. What is the sample size?  B. What is the target sample size for a population of 4,500 people with a standard value of 1.75 and a sampling error of 15%?
What would be the correct response from chiices below concerning the nature of sampling distribution of sample mean
For any sample of size 100, the population mean, the mean of the sampling distribution for the sample means, and the sample mean will always be equal to each other. True False

Chapter 8 Solutions

Understandable Statistics: Concepts and Methods

Ch. 8.1 - Basic Computation: Setting Hypotheses Suppose you...Ch. 8.1 - Basic Computation: Setting Hypotheses Suppose you...Ch. 8.1 - Basic Computation: Find Test Statistic,...Ch. 8.1 - Basic Computation: Find the Test Statistic,...Ch. 8.1 - Veterinary Science: Colts The body weight of a...Ch. 8.1 - Marketing: Shopping Time How much customers buy is...Ch. 8.1 - Meteorology: Storms Weatherwise magazine is...Ch. 8.1 - Chrysler Concorde: Acceleration Consumer Reports...Ch. 8.1 - For Problems 1924, please provide the following...Ch. 8.1 - For Problems 1924, please provide the following...Ch. 8.1 - For Problems 1924, please provide the following...Ch. 8.1 - For Problems 1924, please provide the following...Ch. 8.1 - Prob. 23PCh. 8.1 - Prob. 24PCh. 8.2 - Statistical Literacy For the same sample data and...Ch. 8.2 - Statistical Literacy To test for an x...Ch. 8.2 - Statistical Literacy When using the Students t...Ch. 8.2 - Critical Thinking Consider a test for . If the...Ch. 8.2 - Critical Thinking Consider a test for . If the...Ch. 8.2 - Critical Thinking If sample data is such that for...Ch. 8.2 - Basic Computation: P-value Corresponding to t...Ch. 8.2 - Basic Computation: P-value Corresponding to t...Ch. 8.2 - Basic Computation: Testing , Unknown A random...Ch. 8.2 - Basic Computation: Testing , Unknown A random...Ch. 8.2 - Please provide the following information for...Ch. 8.2 - Please provide the following information for...Ch. 8.2 - Please provide the following information for...Ch. 8.2 - Please provide the following information for...Ch. 8.2 - Please provide the following information for...Ch. 8.2 - Prob. 16PCh. 8.2 - Please provide the following information for...Ch. 8.2 - Prob. 18PCh. 8.2 - Please provide the following information for...Ch. 8.2 - Prob. 20PCh. 8.2 - Prob. 21PCh. 8.2 - Prob. 22PCh. 8.2 - Critical Thinking: One-Tailed versus Two-Tailed...Ch. 8.2 - Prob. 25PCh. 8.2 - Prob. 26PCh. 8.2 - Prob. 27PCh. 8.2 - Prob. 28PCh. 8.2 - Prob. 29PCh. 8.2 - Prob. 30PCh. 8.3 - Statistical Literacy To use the normal...Ch. 8.3 - Statistical Literacy Consider a binomial...Ch. 8.3 - Prob. 3PCh. 8.3 - Critical Thinking An article in a newspaper states...Ch. 8.3 - Basic Computation: Testing p A random sample of 30...Ch. 8.3 - Basic Computation: Testing p A random sample of 60...Ch. 8.3 - Prob. 7PCh. 8.3 - Prob. 8PCh. 8.3 - Prob. 9PCh. 8.3 - For Problems 721, please provide the following...Ch. 8.3 - Prob. 11PCh. 8.3 - For Problems 721, please provide the following...Ch. 8.3 - For Problems 721, please provide the following...Ch. 8.3 - Prob. 14PCh. 8.3 - For Problems 721, please provide the following...Ch. 8.3 - Prob. 16PCh. 8.3 - For Problems 721, please provide the following...Ch. 8.3 - Prob. 18PCh. 8.3 - Prob. 19PCh. 8.3 - Prob. 20PCh. 8.3 - Prob. 21PCh. 8.3 - Prob. 22PCh. 8.3 - Critical Region Method: Testing Proportions Solve...Ch. 8.3 - Prob. 24PCh. 8.4 - Prob. 1PCh. 8.4 - Prob. 2PCh. 8.4 - Prob. 3PCh. 8.4 - Prob. 4PCh. 8.4 - Prob. 5PCh. 8.4 - Prob. 6PCh. 8.4 - Prob. 7PCh. 8.4 - Basic Computation: Paired Differences Test For a...Ch. 8.4 - Prob. 9PCh. 8.4 - Prob. 10PCh. 8.4 - For Problems 921 assume that the distribution of...Ch. 8.4 - For Problems 921 assume that the distribution of...Ch. 8.4 - Prob. 13PCh. 8.4 - Prob. 14PCh. 8.4 - Prob. 15PCh. 8.4 - Prob. 16PCh. 8.4 - For Problems 921 assume that the distribution of...Ch. 8.4 - Prob. 18PCh. 8.4 - Prob. 19PCh. 8.4 - Prob. 20PCh. 8.4 - Prob. 21PCh. 8.4 - Expand Your Knowledge: Confidence Intervals for d...Ch. 8.4 - Prob. 23PCh. 8.4 - Prob. 24PCh. 8.5 - Statistical Literacy Consider a hypothesis test of...Ch. 8.5 - Prob. 2PCh. 8.5 - Prob. 3PCh. 8.5 - Statistical Literacy Consider a hypothesis test of...Ch. 8.5 - Statistical Literacy Consider a hypothesis test of...Ch. 8.5 - Critical Thinking Consider use of a Students t...Ch. 8.5 - Critical Thinking When conducting a test for the...Ch. 8.5 - Critical Thinking When conducting a test for the...Ch. 8.5 - Basic Computation: Testing 1 2 A random sample of...Ch. 8.5 - Basic Computation: Testing 1 2 Two populations...Ch. 8.5 - Basic Computation: Testing 1 2 A random sample of...Ch. 8.5 - Basic Computation: Testing 1 2 Two populations...Ch. 8.5 - Prob. 13PCh. 8.5 - Prob. 14PCh. 8.5 - Please provide the following information for...Ch. 8.5 - Please provide the following information for...Ch. 8.5 - Please provide the following information for...Ch. 8.5 - Please provide the following information for...Ch. 8.5 - Please provide the following information for...Ch. 8.5 - Please provide the following information for...Ch. 8.5 - Prob. 21PCh. 8.5 - Please provide the following information for...Ch. 8.5 - Prob. 23PCh. 8.5 - Prob. 24PCh. 8.5 - Prob. 25PCh. 8.5 - Prob. 26PCh. 8.5 - Prob. 27PCh. 8.5 - Prob. 28PCh. 8.5 - Prob. 29PCh. 8.5 - Prob. 30PCh. 8.5 - Please provide the following information for...Ch. 8.5 - Prob. 32PCh. 8.5 - Prob. 33PCh. 8.5 - Prob. 34PCh. 8.5 - Prob. 35PCh. 8.5 - Prob. 36PCh. 8.5 - Prob. 37PCh. 8.5 - Prob. 38PCh. 8 - Prob. 1CRPCh. 8 - Prob. 2CRPCh. 8 - Critical Thinking All other conditions being...Ch. 8 - Prob. 4CRPCh. 8 - Before you solve each problem below, first...Ch. 8 - Prob. 6CRPCh. 8 - Prob. 7CRPCh. 8 - Prob. 8CRPCh. 8 - Prob. 9CRPCh. 8 - Prob. 10CRPCh. 8 - Prob. 11CRPCh. 8 - Prob. 12CRPCh. 8 - Prob. 13CRPCh. 8 - Prob. 14CRPCh. 8 - Before you solve each problem below, first...Ch. 8 - Prob. 16CRPCh. 8 - Prob. 17CRPCh. 8 - Prob. 18CRPCh. 8 - Discuss each of the following topics in class or...Ch. 8 - Prob. 2LCCh. 8 - Prob. 3LCCh. 8 - Prob. 4LCCh. 8 - Prob. 5LC
Knowledge Booster
Background pattern image
Statistics
Learn more about
Need a deep-dive on the concept behind this application? Look no further. Learn more about this topic, statistics and related others by exploring similar questions and additional content below.
Recommended textbooks for you
Text book image
MATLAB: An Introduction with Applications
Statistics
ISBN:9781119256830
Author:Amos Gilat
Publisher:John Wiley & Sons Inc
Text book image
Probability and Statistics for Engineering and th...
Statistics
ISBN:9781305251809
Author:Jay L. Devore
Publisher:Cengage Learning
Text book image
Statistics for The Behavioral Sciences (MindTap C...
Statistics
ISBN:9781305504912
Author:Frederick J Gravetter, Larry B. Wallnau
Publisher:Cengage Learning
Text book image
Elementary Statistics: Picturing the World (7th E...
Statistics
ISBN:9780134683416
Author:Ron Larson, Betsy Farber
Publisher:PEARSON
Text book image
The Basic Practice of Statistics
Statistics
ISBN:9781319042578
Author:David S. Moore, William I. Notz, Michael A. Fligner
Publisher:W. H. Freeman
Text book image
Introduction to the Practice of Statistics
Statistics
ISBN:9781319013387
Author:David S. Moore, George P. McCabe, Bruce A. Craig
Publisher:W. H. Freeman
Statistics 4.1 Point Estimators; Author: Dr. Jack L. Jackson II;https://www.youtube.com/watch?v=2MrI0J8XCEE;License: Standard YouTube License, CC-BY
Statistics 101: Point Estimators; Author: Brandon Foltz;https://www.youtube.com/watch?v=4v41z3HwLaM;License: Standard YouTube License, CC-BY
Central limit theorem; Author: 365 Data Science;https://www.youtube.com/watch?v=b5xQmk9veZ4;License: Standard YouTube License, CC-BY
Point Estimate Definition & Example; Author: Prof. Essa;https://www.youtube.com/watch?v=OTVwtvQmSn0;License: Standard Youtube License
Point Estimation; Author: Vamsidhar Ambatipudi;https://www.youtube.com/watch?v=flqhlM2bZWc;License: Standard Youtube License