Understandable Statistics: Concepts and Methods
12th Edition
ISBN: 9781337119917
Author: Charles Henry Brase, Corrinne Pellillo Brase
Publisher: Cengage Learning
bartleby

Concept explainers

bartleby

Videos

Question
Book Icon
Chapter 8.5, Problem 29P

(a)

To determine

Find the level of significance.

State the null and alternative hypothesis.

(a)

Expert Solution
Check Mark

Answer to Problem 29P

The level of significance is 0.05.

The null hypothesis is H0:p1=p2.

The alternative hypothesis is H1:p1p2.

Explanation of Solution

Calculation:

Let p1 denotes the population proportion of women who favor spending more federal tax dollars on the arts, p2 denotes the population proportion of women who favor spending more federal tax dollars on the arts.

From the given information the value of α is 0.05, and there is difference between the population proportion of women and the population proportion of men who favor spending more federal tax dollars on the arts.

Hence, the level of significance is 0.05.

The null and alternative hypothesis is,

Null hypothesis:

H0:p1=p2

Alternative hypothesis:

H1:p1p2

(b)

To determine

Identify the sampling distribution to be used.

Mention the assumption to test.

Find the sample test statistic.

Find the z value.

(b)

Expert Solution
Check Mark

Answer to Problem 29P

The sampling distribution to be used is normal distribution.

The sample test statistic is –1.13.

The z value is ±1.96.

Explanation of Solution

Calculation:

Conditions:

Consider binomial experiment 1 with n1 number of trails, r1 number of success, probability of success for each trail p1 and probability of failure q1=1p1. And binomial experiment 2 with n2 number of trails, r2 number of success, probability of success for each trail p2 and probability of failure q2=1p2.

Also, p^1=r1n1 is the sample proportion of first sample where r1 is the successes out of n1 trials for the first population and p^2=r2n2 is the sample proportion of second sample where r2 is the successes out of n2 trials for the second population.

For sufficiently larger number of trails the following four conditions must be satisfied to use sample test statistic p^1p^2 with z value are,

  • n1p¯>5
  • n1q¯>5
  • n2p¯>5
  • n2q¯>5

Where, p¯=r1+r2n1+n2 is the pooled estimate of proportion, with total number of successes (r1+r2) and total number of trials (n1+n2).

q¯=1p¯ is the pooled estimate of proportion of failure.

The two sample z statistic for proportion is,

z=p^1p^2p¯q¯n1+p¯q¯n1

In the formula,

p^1=r1n1 is the sample proportion of first sample where r1 is the successes out of n1 trials for the first population.

p^2=r2n2 is the sample proportion of first sample where r2 is the successes out of n2 trials for the first population.

p¯=r1+r2n1+n2 is the pooled estimate of proportion, with total number of successes (r1+r2) and total number of trials (n1+n2).

q¯=1p¯ is the pooled estimate of proportion of failure.

The pooled probability of success for the two experiments is,

p¯=59+56220+175=115395=0.2911

The pooled probability of success for the two experiments is 0.2911.

Checking conditions:

n1p¯=220(0.2911)=64.042>5

n2p¯=175(0.2911)=50.9425>5

n1q¯=n1(1p¯)=220(10.2911)=220(0.7089)=155.958>5

n2q¯=n2(1p¯)=175(10.2911)=175(0.7089)=124.0575>5

It can be observed that two of the conditions n1p¯>5, n2p¯>5, n1q¯>5, n1q¯>5 are satisfied. It is appropriate to use normal distribution.

Hence, distribution of the sample test statistic normal distribution.

The value of p^1p^2 is,

p^1p^2=5922056175=0.2680.32=0.052

The value of p^1p^2 is –0.052.

Z-statistic:

Substitute p^1 as 0.268, p^2 as 0.32, p¯ as 0.2911, q¯ as 0.7089, n1 as 220, and n2 as 175 in the test statistic formula

z=0.2680.320.2911×0.7089220+0.2911×0.7089175=0.0520.0460=1.13

Hence, the sample test statistic is –1.13.

Critical value:

Use the Appendix II: Tables, Table 5 (c): Hypothesis Testing, Critical Values z0.

  • In the row of level of significance locate the level of significance α=0.05.
  • Locate the corresponding critical value z0 for a two-tailed test for α=0.05.
  • The intersecting value of row and columns is ±1.96.

Hence, the z value is ±1.96.

(c)

To determine

Find the P-value.

Draw the sampling distribution by showing the area corresponding to the P-value.

(c)

Expert Solution
Check Mark

Answer to Problem 29P

The P-value is 0.2584.

Explanation of Solution

Calculation:

Step by step procedure to obtain P-value using MINITAB software is given below:

  • Choose Graph > Probability Distribution Plot choose View Probability > OK.
  • From Distribution, choose ‘Normal’ distribution.
  • Click the Shaded Area tab.
  • Choose X Value and Both Tails, for the region of the curve to shade.
  • Enter the X value as –1.13.
  • Click OK.

Output using MINITAB software is given below:

Understandable Statistics: Concepts and Methods, Chapter 8.5, Problem 29P

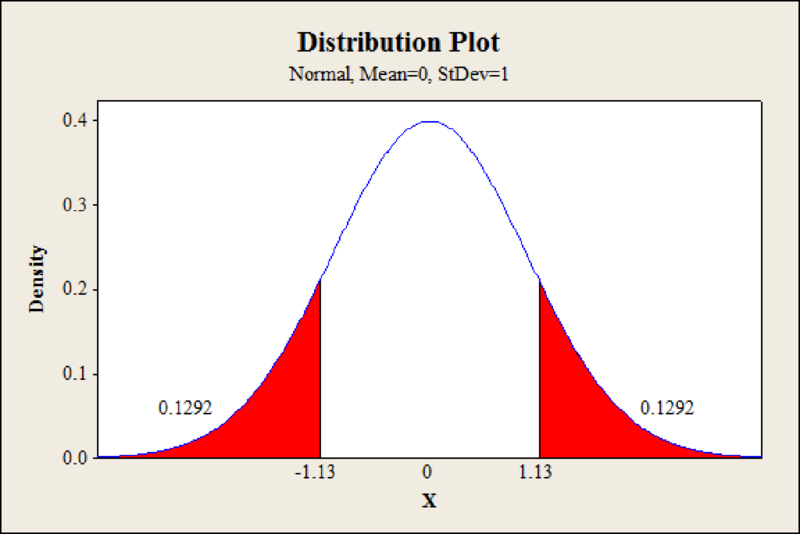
From Minitab output, the P-value is 0.1292 which is one sided value.

The P-value for the two-tailed value is,

P-value=2×0.1292=0.2584

Hence, the P-value of the sample test statistic is 0.2584.

(d)

To determine

Check whether the null hypothesis is rejecting or fail to reject.

Identify whether the data statistically significant at level 0.05 or not.

(d)

Expert Solution
Check Mark

Answer to Problem 29P

The null hypothesis is not rejected.

The data is not statistically significant at level 0.05.

Explanation of Solution

Calculation:

From part (c), the P-value is 0.2584.

Rejection rule:

  • If the P-value is less than or equal to α, then reject the null hypothesis and the test is statistically significant. That is, P-valueα.

Conclusion:

The P-value is 0.2584 and the level of significance is 0.05.

The P-value is greater than the level of significance.

That is, 0.2584(=P-value)>0.05(=α).

By the rejection rule, the null hypothesis is not rejected.

Hence, the data is not statistically significant at level 0.05.

(e)

To determine

Interpret the conclusion in the context of the application.

(e)

Expert Solution
Check Mark

Explanation of Solution

Calculation:

From part (d), the null hypothesis is not rejected. This shows that, there is no sufficient evidence that there is difference between the population proportion of women and the population proportion of men who favor spending more federal tax dollars on the arts at level of significance 0.05.

Want to see more full solutions like this?

Subscribe now to access step-by-step solutions to millions of textbook problems written by subject matter experts!

Chapter 8 Solutions

Understandable Statistics: Concepts and Methods

Ch. 8.1 - Basic Computation: Setting Hypotheses Suppose you...Ch. 8.1 - Basic Computation: Setting Hypotheses Suppose you...Ch. 8.1 - Basic Computation: Find Test Statistic,...Ch. 8.1 - Basic Computation: Find the Test Statistic,...Ch. 8.1 - Veterinary Science: Colts The body weight of a...Ch. 8.1 - Marketing: Shopping Time How much customers buy is...Ch. 8.1 - Meteorology: Storms Weatherwise magazine is...Ch. 8.1 - Chrysler Concorde: Acceleration Consumer Reports...Ch. 8.1 - For Problems 1924, please provide the following...Ch. 8.1 - For Problems 1924, please provide the following...Ch. 8.1 - For Problems 1924, please provide the following...Ch. 8.1 - For Problems 1924, please provide the following...Ch. 8.1 - Prob. 23PCh. 8.1 - Prob. 24PCh. 8.2 - Statistical Literacy For the same sample data and...Ch. 8.2 - Statistical Literacy To test for an x...Ch. 8.2 - Statistical Literacy When using the Students t...Ch. 8.2 - Critical Thinking Consider a test for . If the...Ch. 8.2 - Critical Thinking Consider a test for . If the...Ch. 8.2 - Critical Thinking If sample data is such that for...Ch. 8.2 - Basic Computation: P-value Corresponding to t...Ch. 8.2 - Basic Computation: P-value Corresponding to t...Ch. 8.2 - Basic Computation: Testing , Unknown A random...Ch. 8.2 - Basic Computation: Testing , Unknown A random...Ch. 8.2 - Please provide the following information for...Ch. 8.2 - Please provide the following information for...Ch. 8.2 - Please provide the following information for...Ch. 8.2 - Please provide the following information for...Ch. 8.2 - Please provide the following information for...Ch. 8.2 - Prob. 16PCh. 8.2 - Please provide the following information for...Ch. 8.2 - Prob. 18PCh. 8.2 - Please provide the following information for...Ch. 8.2 - Prob. 20PCh. 8.2 - Prob. 21PCh. 8.2 - Prob. 22PCh. 8.2 - Critical Thinking: One-Tailed versus Two-Tailed...Ch. 8.2 - Prob. 25PCh. 8.2 - Prob. 26PCh. 8.2 - Prob. 27PCh. 8.2 - Prob. 28PCh. 8.2 - Prob. 29PCh. 8.2 - Prob. 30PCh. 8.3 - Statistical Literacy To use the normal...Ch. 8.3 - Statistical Literacy Consider a binomial...Ch. 8.3 - Prob. 3PCh. 8.3 - Critical Thinking An article in a newspaper states...Ch. 8.3 - Basic Computation: Testing p A random sample of 30...Ch. 8.3 - Basic Computation: Testing p A random sample of 60...Ch. 8.3 - Prob. 7PCh. 8.3 - Prob. 8PCh. 8.3 - Prob. 9PCh. 8.3 - For Problems 721, please provide the following...Ch. 8.3 - Prob. 11PCh. 8.3 - For Problems 721, please provide the following...Ch. 8.3 - For Problems 721, please provide the following...Ch. 8.3 - Prob. 14PCh. 8.3 - For Problems 721, please provide the following...Ch. 8.3 - Prob. 16PCh. 8.3 - For Problems 721, please provide the following...Ch. 8.3 - Prob. 18PCh. 8.3 - Prob. 19PCh. 8.3 - Prob. 20PCh. 8.3 - Prob. 21PCh. 8.3 - Prob. 22PCh. 8.3 - Critical Region Method: Testing Proportions Solve...Ch. 8.3 - Prob. 24PCh. 8.4 - Prob. 1PCh. 8.4 - Prob. 2PCh. 8.4 - Prob. 3PCh. 8.4 - Prob. 4PCh. 8.4 - Prob. 5PCh. 8.4 - Prob. 6PCh. 8.4 - Prob. 7PCh. 8.4 - Basic Computation: Paired Differences Test For a...Ch. 8.4 - Prob. 9PCh. 8.4 - Prob. 10PCh. 8.4 - For Problems 921 assume that the distribution of...Ch. 8.4 - For Problems 921 assume that the distribution of...Ch. 8.4 - Prob. 13PCh. 8.4 - Prob. 14PCh. 8.4 - Prob. 15PCh. 8.4 - Prob. 16PCh. 8.4 - For Problems 921 assume that the distribution of...Ch. 8.4 - Prob. 18PCh. 8.4 - Prob. 19PCh. 8.4 - Prob. 20PCh. 8.4 - Prob. 21PCh. 8.4 - Expand Your Knowledge: Confidence Intervals for d...Ch. 8.4 - Prob. 23PCh. 8.4 - Prob. 24PCh. 8.5 - Statistical Literacy Consider a hypothesis test of...Ch. 8.5 - Prob. 2PCh. 8.5 - Prob. 3PCh. 8.5 - Statistical Literacy Consider a hypothesis test of...Ch. 8.5 - Statistical Literacy Consider a hypothesis test of...Ch. 8.5 - Critical Thinking Consider use of a Students t...Ch. 8.5 - Critical Thinking When conducting a test for the...Ch. 8.5 - Critical Thinking When conducting a test for the...Ch. 8.5 - Basic Computation: Testing 1 2 A random sample of...Ch. 8.5 - Basic Computation: Testing 1 2 Two populations...Ch. 8.5 - Basic Computation: Testing 1 2 A random sample of...Ch. 8.5 - Basic Computation: Testing 1 2 Two populations...Ch. 8.5 - Prob. 13PCh. 8.5 - Prob. 14PCh. 8.5 - Please provide the following information for...Ch. 8.5 - Please provide the following information for...Ch. 8.5 - Please provide the following information for...Ch. 8.5 - Please provide the following information for...Ch. 8.5 - Please provide the following information for...Ch. 8.5 - Please provide the following information for...Ch. 8.5 - Prob. 21PCh. 8.5 - Please provide the following information for...Ch. 8.5 - Prob. 23PCh. 8.5 - Prob. 24PCh. 8.5 - Prob. 25PCh. 8.5 - Prob. 26PCh. 8.5 - Prob. 27PCh. 8.5 - Prob. 28PCh. 8.5 - Prob. 29PCh. 8.5 - Prob. 30PCh. 8.5 - Please provide the following information for...Ch. 8.5 - Prob. 32PCh. 8.5 - Prob. 33PCh. 8.5 - Prob. 34PCh. 8.5 - Prob. 35PCh. 8.5 - Prob. 36PCh. 8.5 - Prob. 37PCh. 8.5 - Prob. 38PCh. 8 - Prob. 1CRPCh. 8 - Prob. 2CRPCh. 8 - Critical Thinking All other conditions being...Ch. 8 - Prob. 4CRPCh. 8 - Before you solve each problem below, first...Ch. 8 - Prob. 6CRPCh. 8 - Prob. 7CRPCh. 8 - Prob. 8CRPCh. 8 - Prob. 9CRPCh. 8 - Prob. 10CRPCh. 8 - Prob. 11CRPCh. 8 - Prob. 12CRPCh. 8 - Prob. 13CRPCh. 8 - Prob. 14CRPCh. 8 - Before you solve each problem below, first...Ch. 8 - Prob. 16CRPCh. 8 - Prob. 17CRPCh. 8 - Prob. 18CRPCh. 8 - Discuss each of the following topics in class or...Ch. 8 - Prob. 2LCCh. 8 - Prob. 3LCCh. 8 - Prob. 4LCCh. 8 - Prob. 5LC
Knowledge Booster
Background pattern image
Statistics
Learn more about
Need a deep-dive on the concept behind this application? Look no further. Learn more about this topic, statistics and related others by exploring similar questions and additional content below.
Recommended textbooks for you
Text book image
MATLAB: An Introduction with Applications
Statistics
ISBN:9781119256830
Author:Amos Gilat
Publisher:John Wiley & Sons Inc
Text book image
Probability and Statistics for Engineering and th...
Statistics
ISBN:9781305251809
Author:Jay L. Devore
Publisher:Cengage Learning
Text book image
Statistics for The Behavioral Sciences (MindTap C...
Statistics
ISBN:9781305504912
Author:Frederick J Gravetter, Larry B. Wallnau
Publisher:Cengage Learning
Text book image
Elementary Statistics: Picturing the World (7th E...
Statistics
ISBN:9780134683416
Author:Ron Larson, Betsy Farber
Publisher:PEARSON
Text book image
The Basic Practice of Statistics
Statistics
ISBN:9781319042578
Author:David S. Moore, William I. Notz, Michael A. Fligner
Publisher:W. H. Freeman
Text book image
Introduction to the Practice of Statistics
Statistics
ISBN:9781319013387
Author:David S. Moore, George P. McCabe, Bruce A. Craig
Publisher:W. H. Freeman
Statistics 4.1 Point Estimators; Author: Dr. Jack L. Jackson II;https://www.youtube.com/watch?v=2MrI0J8XCEE;License: Standard YouTube License, CC-BY
Statistics 101: Point Estimators; Author: Brandon Foltz;https://www.youtube.com/watch?v=4v41z3HwLaM;License: Standard YouTube License, CC-BY
Central limit theorem; Author: 365 Data Science;https://www.youtube.com/watch?v=b5xQmk9veZ4;License: Standard YouTube License, CC-BY
Point Estimate Definition & Example; Author: Prof. Essa;https://www.youtube.com/watch?v=OTVwtvQmSn0;License: Standard Youtube License
Point Estimation; Author: Vamsidhar Ambatipudi;https://www.youtube.com/watch?v=flqhlM2bZWc;License: Standard Youtube License