Understandable Statistics: Concepts and Methods
12th Edition
ISBN: 9781337119917
Author: Charles Henry Brase, Corrinne Pellillo Brase
Publisher: Cengage Learning
bartleby

Videos

Question
Book Icon
Chapter 8.4, Problem 14P

(a)

To determine

Find the level of significance.

State the null and alternative hypothesis.

Identify the tail of test.

(a)

Expert Solution
Check Mark

Answer to Problem 14P

The level of significance is 0.01.

The null hypothesis is H0:μd=0.

The alternative hypothesis is H1:μd0.

The tail of the test is two-tailed.

Explanation of Solution

Calculation:

Let μd denotes the population mean of the differences.

From the given information the value of α is 0.01, and the data indicate a difference between population average birth rate and death rate in this region.

Hence, the level of significance is 0.01.

The null and alternative hypothesis is,

Null hypothesis:

H0:μd=0

Alternative hypothesis:

H1:μd0

In this situation the alternative hypothesis is not equal indicates that the test is two-tailed test.

Hence, the tail of the test is two-tailed test.

(b)

To determine

Identify the sampling distribution to be used.

Mention the assumption to test.

Find the value of the sample test statistic.

Find the t value.

(b)

Expert Solution
Check Mark

Answer to Problem 14P

The sampling distribution to be used is Student’s t distribution.

The Student’s t distribution is chosen because the distribution of differences is approximately normal.

The value of the sample test statistic is 1.1.

The t value is 1.175.

Explanation of Solution

Calculation:

Conditions:

  • When the d distribution considered in the study has the normal distribution or simply has a mound-shaped, symmetric distribution then the sampling distribution d¯ has Student’s t distribution for any sample size n. The t statistic is used for testing.
  • When the d distribution considered in the study is not normally distributed then the sampling distribution d¯ has Student’s t distribution if the sample size n is greater than or equal 30. That is, n30.

Test statistic for t:

The t statistic value for sample test statistic d¯ is,

t=d¯μd(sdn)

In the formula d¯ is sample test statistic, μd is specified in H0, sσ is sample standard deviation of the differences d, and n is the number of data pairs.

The distribution of differences is approximately normal is assumed.

It is clear that the distribution of differences is approximately normal. Hence, the sampling distribution to be used is Student’s t distribution.

Difference:

A12.713.412.812.111.611.114.215.1
B9.814.510.714.213.012.910.910.0
d=AB2.9–1.12.1–2.1–1.4–1.83.35.1
A12.512.313.115.810.312.711.115.7
B14.113.69.110.217.911.87.09.2
d=AB–1.6–1.34.05.6–7.60.94.16.5

Mean and standard deviation for difference:

Step by step procedure to obtain mean and standard deviation using MINITAB software is given as,

  • Choose Stat > Basic Statistics > Display Descriptive Statistics.
  • In Variables enter the column d.
  • Choose option statistics, and select Mean, standard deviation.
  • Click OK.

Output using MINITAB software is given below:

Understandable Statistics: Concepts and Methods, Chapter 8.4, Problem 14P , additional homework tip  1

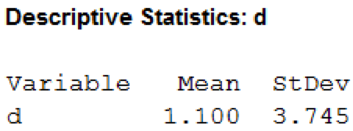
From MINITAB output, the mean of the differences d is 1.10, and standard deviation of the differences d is 3.745.

The value of the sample test statistic is 1.1.

T-statistic:

Substitute d¯ as 1.10, μd as 0, sσ as 3.745, and n as 16 in the test statistic formula

t=1.100(3.74516)=1.100.93625=1.175

Hence, the t-value of the sample test statistic is 1.175.

(c)

To determine

Find the P-value.

Draw the sampling distribution by showing the area corresponding to the P-value.

(c)

Expert Solution
Check Mark

Answer to Problem 14P

The P-value is 0.2584.

Explanation of Solution

Calculation:

Degrees of freedom:

The degrees of freedom for the t distribution is,

d.f.=n1

In the formula n is the number of data pairs.

Substitute n as 16 in the degrees of freedom formula

d.f.=n1=161=15

Step by step procedure to obtain P-value using MINITAB software is given below:

  • Choose Graph > Probability Distribution Plot choose View Probability > OK.
  • From Distribution, choose ‘t’ distribution.
  • Enter the Degrees of freedom as 15.
  • Click the Shaded Area tab.
  • Choose X Value and Both Tails, for the region of the curve to shade.
  • Enter the X value as 1.175.
  • Click OK.

Output using MINITAB software is given below:

Understandable Statistics: Concepts and Methods, Chapter 8.4, Problem 14P , additional homework tip  2

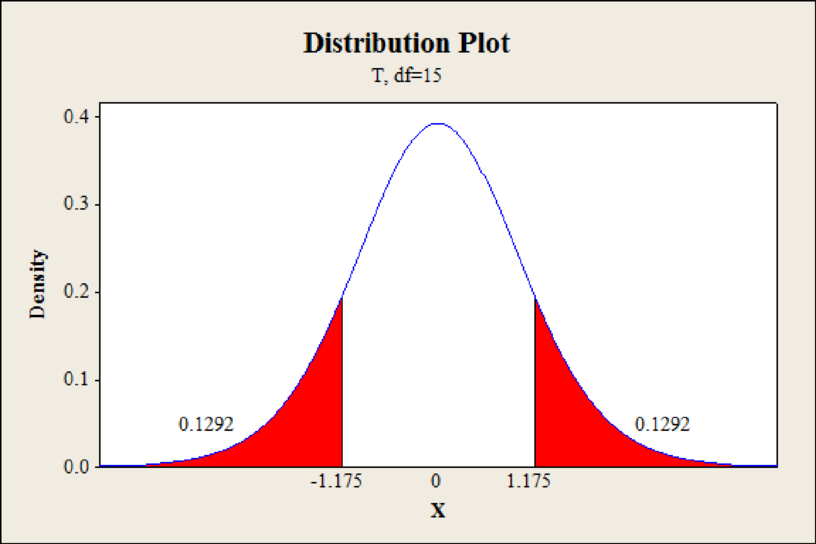
From Minitab output, the P-value is 0.1292 which is one sided value.

The two-tailed P-value is,

P-value=2×0.1292=0.2584

Hence, the P-value is 0.2584.

(d)

To determine

Check whether the null hypothesis is rejecting or fail to reject.

Identify whether the data statistically significant at level 0.01 or not.

(d)

Expert Solution
Check Mark

Answer to Problem 14P

The null hypothesis is not rejected.

The data is not statistically significant at level 0.01.

Explanation of Solution

Calculation:

From part (c), the P-value is 0.2584.

Rejection rule:

  • If the P-value is less than or equal to α, then reject the null hypothesis and the test is statistically significant. That is, P-valueα.

Conclusion:

The P-value is 0.2584 and the level of significance is 0.01.

The P-value is greater than the level of significance.

That is, 0.2584(=P-value)>0.01(=α).

By the rejection rule, the null hypothesis is not rejected.

Hence, the data is not statistically significant at level 0.01.

(e)

To determine

Interpret the conclusion in the context of the application.

(e)

Expert Solution
Check Mark

Explanation of Solution

Calculation:

From part (d), the null hypothesis is not rejected. This shows that, there is no evidence that the data indicate a difference between population average birth rate and death rate in this region at level of significance 0.01.

Want to see more full solutions like this?

Subscribe now to access step-by-step solutions to millions of textbook problems written by subject matter experts!

Chapter 8 Solutions

Understandable Statistics: Concepts and Methods

Ch. 8.1 - Basic Computation: Setting Hypotheses Suppose you...Ch. 8.1 - Basic Computation: Setting Hypotheses Suppose you...Ch. 8.1 - Basic Computation: Find Test Statistic,...Ch. 8.1 - Basic Computation: Find the Test Statistic,...Ch. 8.1 - Veterinary Science: Colts The body weight of a...Ch. 8.1 - Marketing: Shopping Time How much customers buy is...Ch. 8.1 - Meteorology: Storms Weatherwise magazine is...Ch. 8.1 - Chrysler Concorde: Acceleration Consumer Reports...Ch. 8.1 - For Problems 1924, please provide the following...Ch. 8.1 - For Problems 1924, please provide the following...Ch. 8.1 - For Problems 1924, please provide the following...Ch. 8.1 - For Problems 1924, please provide the following...Ch. 8.1 - Prob. 23PCh. 8.1 - Prob. 24PCh. 8.2 - Statistical Literacy For the same sample data and...Ch. 8.2 - Statistical Literacy To test for an x...Ch. 8.2 - Statistical Literacy When using the Students t...Ch. 8.2 - Critical Thinking Consider a test for . If the...Ch. 8.2 - Critical Thinking Consider a test for . If the...Ch. 8.2 - Critical Thinking If sample data is such that for...Ch. 8.2 - Basic Computation: P-value Corresponding to t...Ch. 8.2 - Basic Computation: P-value Corresponding to t...Ch. 8.2 - Basic Computation: Testing , Unknown A random...Ch. 8.2 - Basic Computation: Testing , Unknown A random...Ch. 8.2 - Please provide the following information for...Ch. 8.2 - Please provide the following information for...Ch. 8.2 - Please provide the following information for...Ch. 8.2 - Please provide the following information for...Ch. 8.2 - Please provide the following information for...Ch. 8.2 - Prob. 16PCh. 8.2 - Please provide the following information for...Ch. 8.2 - Prob. 18PCh. 8.2 - Please provide the following information for...Ch. 8.2 - Prob. 20PCh. 8.2 - Prob. 21PCh. 8.2 - Prob. 22PCh. 8.2 - Critical Thinking: One-Tailed versus Two-Tailed...Ch. 8.2 - Prob. 25PCh. 8.2 - Prob. 26PCh. 8.2 - Prob. 27PCh. 8.2 - Prob. 28PCh. 8.2 - Prob. 29PCh. 8.2 - Prob. 30PCh. 8.3 - Statistical Literacy To use the normal...Ch. 8.3 - Statistical Literacy Consider a binomial...Ch. 8.3 - Prob. 3PCh. 8.3 - Critical Thinking An article in a newspaper states...Ch. 8.3 - Basic Computation: Testing p A random sample of 30...Ch. 8.3 - Basic Computation: Testing p A random sample of 60...Ch. 8.3 - Prob. 7PCh. 8.3 - Prob. 8PCh. 8.3 - Prob. 9PCh. 8.3 - For Problems 721, please provide the following...Ch. 8.3 - Prob. 11PCh. 8.3 - For Problems 721, please provide the following...Ch. 8.3 - For Problems 721, please provide the following...Ch. 8.3 - Prob. 14PCh. 8.3 - For Problems 721, please provide the following...Ch. 8.3 - Prob. 16PCh. 8.3 - For Problems 721, please provide the following...Ch. 8.3 - Prob. 18PCh. 8.3 - Prob. 19PCh. 8.3 - Prob. 20PCh. 8.3 - Prob. 21PCh. 8.3 - Prob. 22PCh. 8.3 - Critical Region Method: Testing Proportions Solve...Ch. 8.3 - Prob. 24PCh. 8.4 - Prob. 1PCh. 8.4 - Prob. 2PCh. 8.4 - Prob. 3PCh. 8.4 - Prob. 4PCh. 8.4 - Prob. 5PCh. 8.4 - Prob. 6PCh. 8.4 - Prob. 7PCh. 8.4 - Basic Computation: Paired Differences Test For a...Ch. 8.4 - Prob. 9PCh. 8.4 - Prob. 10PCh. 8.4 - For Problems 921 assume that the distribution of...Ch. 8.4 - For Problems 921 assume that the distribution of...Ch. 8.4 - Prob. 13PCh. 8.4 - Prob. 14PCh. 8.4 - Prob. 15PCh. 8.4 - Prob. 16PCh. 8.4 - For Problems 921 assume that the distribution of...Ch. 8.4 - Prob. 18PCh. 8.4 - Prob. 19PCh. 8.4 - Prob. 20PCh. 8.4 - Prob. 21PCh. 8.4 - Expand Your Knowledge: Confidence Intervals for d...Ch. 8.4 - Prob. 23PCh. 8.4 - Prob. 24PCh. 8.5 - Statistical Literacy Consider a hypothesis test of...Ch. 8.5 - Prob. 2PCh. 8.5 - Prob. 3PCh. 8.5 - Statistical Literacy Consider a hypothesis test of...Ch. 8.5 - Statistical Literacy Consider a hypothesis test of...Ch. 8.5 - Critical Thinking Consider use of a Students t...Ch. 8.5 - Critical Thinking When conducting a test for the...Ch. 8.5 - Critical Thinking When conducting a test for the...Ch. 8.5 - Basic Computation: Testing 1 2 A random sample of...Ch. 8.5 - Basic Computation: Testing 1 2 Two populations...Ch. 8.5 - Basic Computation: Testing 1 2 A random sample of...Ch. 8.5 - Basic Computation: Testing 1 2 Two populations...Ch. 8.5 - Prob. 13PCh. 8.5 - Prob. 14PCh. 8.5 - Please provide the following information for...Ch. 8.5 - Please provide the following information for...Ch. 8.5 - Please provide the following information for...Ch. 8.5 - Please provide the following information for...Ch. 8.5 - Please provide the following information for...Ch. 8.5 - Please provide the following information for...Ch. 8.5 - Prob. 21PCh. 8.5 - Please provide the following information for...Ch. 8.5 - Prob. 23PCh. 8.5 - Prob. 24PCh. 8.5 - Prob. 25PCh. 8.5 - Prob. 26PCh. 8.5 - Prob. 27PCh. 8.5 - Prob. 28PCh. 8.5 - Prob. 29PCh. 8.5 - Prob. 30PCh. 8.5 - Please provide the following information for...Ch. 8.5 - Prob. 32PCh. 8.5 - Prob. 33PCh. 8.5 - Prob. 34PCh. 8.5 - Prob. 35PCh. 8.5 - Prob. 36PCh. 8.5 - Prob. 37PCh. 8.5 - Prob. 38PCh. 8 - Prob. 1CRPCh. 8 - Prob. 2CRPCh. 8 - Critical Thinking All other conditions being...Ch. 8 - Prob. 4CRPCh. 8 - Before you solve each problem below, first...Ch. 8 - Prob. 6CRPCh. 8 - Prob. 7CRPCh. 8 - Prob. 8CRPCh. 8 - Prob. 9CRPCh. 8 - Prob. 10CRPCh. 8 - Prob. 11CRPCh. 8 - Prob. 12CRPCh. 8 - Prob. 13CRPCh. 8 - Prob. 14CRPCh. 8 - Before you solve each problem below, first...Ch. 8 - Prob. 16CRPCh. 8 - Prob. 17CRPCh. 8 - Prob. 18CRPCh. 8 - Discuss each of the following topics in class or...Ch. 8 - Prob. 2LCCh. 8 - Prob. 3LCCh. 8 - Prob. 4LCCh. 8 - Prob. 5LC
Knowledge Booster
Background pattern image
Statistics
Learn more about
Need a deep-dive on the concept behind this application? Look no further. Learn more about this topic, statistics and related others by exploring similar questions and additional content below.
Recommended textbooks for you
Text book image
MATLAB: An Introduction with Applications
Statistics
ISBN:9781119256830
Author:Amos Gilat
Publisher:John Wiley & Sons Inc
Text book image
Probability and Statistics for Engineering and th...
Statistics
ISBN:9781305251809
Author:Jay L. Devore
Publisher:Cengage Learning
Text book image
Statistics for The Behavioral Sciences (MindTap C...
Statistics
ISBN:9781305504912
Author:Frederick J Gravetter, Larry B. Wallnau
Publisher:Cengage Learning
Text book image
Elementary Statistics: Picturing the World (7th E...
Statistics
ISBN:9780134683416
Author:Ron Larson, Betsy Farber
Publisher:PEARSON
Text book image
The Basic Practice of Statistics
Statistics
ISBN:9781319042578
Author:David S. Moore, William I. Notz, Michael A. Fligner
Publisher:W. H. Freeman
Text book image
Introduction to the Practice of Statistics
Statistics
ISBN:9781319013387
Author:David S. Moore, George P. McCabe, Bruce A. Craig
Publisher:W. H. Freeman
Hypothesis Testing using Confidence Interval Approach; Author: BUM2413 Applied Statistics UMP;https://www.youtube.com/watch?v=Hq1l3e9pLyY;License: Standard YouTube License, CC-BY
Hypothesis Testing - Difference of Two Means - Student's -Distribution & Normal Distribution; Author: The Organic Chemistry Tutor;https://www.youtube.com/watch?v=UcZwyzwWU7o;License: Standard Youtube License