
Videos
Comparing taste-test rating protocols. Taste-testers of new food products are presented with several competing food samples and asked to rate the taste of each on a 9-point scale (where 1 =“dislike extremely” and 9 =“like extremely”). In the Journal of Sensory Studies (June 2014), food scientists compared two different taste-testing protocols. The sequential monadic (SM) method presented the samples one-at-a-time to the taster in a random order, while the rank rating (RR) method presented the samples to the taster all at once, side-by-side. Consider the following experiment (similar to the one conducted in the journal): 50 consumers of apricot jelly were asked to taste-test five different varieties. Half the testers used the SM protocol and half used the RR protocol during testing. In a second experiment, 50 consumers of cheese were asked to taste-test four different varieties. Again, half the testers used the SM protocol and half used the RR protocol during testing. For each product (apricot jelly and cheese), the
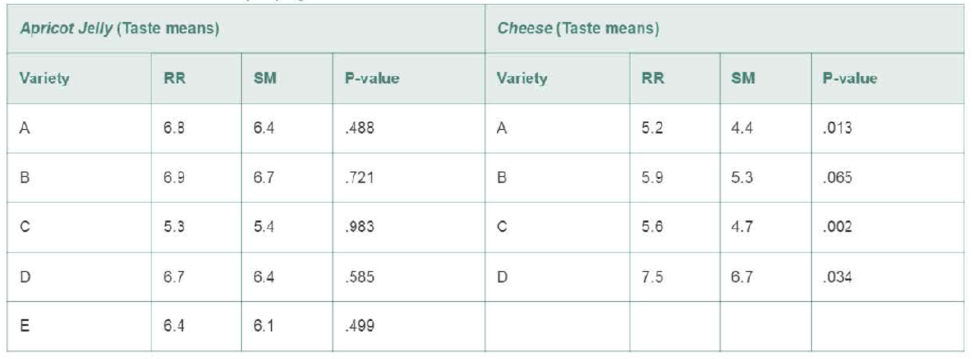
- a. Consider the five varieties of apricot jelly. Identify the varieties for which you can conclude that “the mean taste scores of the two protocols (SM and RR) differ significantly at α = .05.”
- b. Consider the four varieties of cheese. Identify the varieties for which you can conclude that “the mean taste scores of the two protocols (SM and RR) differ significantly at α = .05.”
- c. Explain why the taste-test scores do not need to be
normally distributed for the inferences, parts a and b, to be valid.
Want to see the full answer?
Check out a sample textbook solution
Chapter 8 Solutions
STATISTICSMYSTAT LAB ACCESS CODE + PHS


- A research article on the effect of multitasking on grade performance describes an experiment in which 62 undergraduate business students were randomly assigned to one of two experimental groups. Students in one group were asked to listen to a lecture but were told that they were permitted to use cell phones to send text messages during the lecture. Students in the second group listened to the same lecture but were not permitted to send text messages. Afterwards, students in both groups took a quiz on material covered in the lecture. Data from this experiment are summarized in the accompanying table.arrow_forwardResearchers investigated whether elementary school students from families in need would choose healthier lunch options if offered. A random sample of students receiving free-and-reduced lunch at five different Connecticut elementary schools were offered a choice between 2 lunch options. One was a typical school lunch prepared off and warmed on campus, while the other was a healthier school lunch made on campus from a variety of fruits, vegetables, and lean protein. For each child, researchers kept track of whether or not the child selected the healthier option. The research question was whether of not the healthier option would be selected less than the typical school lunch. More specifically, we will investigate whether the sample data provide strong evidence that the heather lunch is picked less than 50% of the time? The researchers found in their sample of 294 students that 134 picked the healthier option. The value of the sample proportion who selected the candy is therefore…arrow_forwardResearchers Kaitlin Woolley and Ayelet Fishbach (2019) told participants that they were participating in a study on the effects of Hunger. Pairs of participants were told to eat a snack of salsa and chips with a stranger, after which they engaged in a negotiation task. After which, they engaged in a negotation task. Half of the participant-pairs were randomly assigned to share a plate of salsa and chips, and the other half of participant-pairs were randomly assigned to eat their own individual servings. More specifically, the researchers reported that "participants were run in pairs of strangers. We preregistered the study and collected data from 200 undergraduate and graduate students outside a campus cafe (107 female; M=23.57 years, SD=8.80)" What did the researchers mean when they said they "preregistered the study"? a. They registered the study on a website so that students could signup to participate b. They recorded their research design and analysis plan before conducting the…arrow_forward
- A researcher plans to conduct a research study comparing two treatment conditions with a total of 20 participants. Which of the following designs would produce 20 scores in each treatment? a) An independent-measures designb) A repeated-measures designc) A matched-subjects designd) All of the other options would produce 20 scores in each treatment.arrow_forwardA researcher plans to conduct a research study comparing two treatment conditions with a total of 20 scores in each treatment. Which of the following designs would require only 20 participants? a. independent-samples design b. matched-subjects design c. between-subjects design d. within-subjects designarrow_forwardA market-research group specializes in providing assessments of the prospects of sites for new children’s toy stores in shopping centers. The group assesses prospects as good, fair, or poor. The records of assessments made by this group were examined, and it was found that for all stores that had annual sales over $1,000,000, the assessments were good for 70%, fair for 20%, and poor for 10%. For all stores that turned out to be unsuccessful, the assessments were good for 20%, fair for 30%, and poor for 50%. It is known that 60% of new clothing stores are successful and 40% are unsuccessful.a. For a randomly chosen store, what is the probability that prospects will be assessed as good?b. If prospects for a store are assessed as good, what is the probability that it will be successful?c. Are the events “prospects assessed as good” and “store is successful” statistically independent?d. Suppose that five stores are chosen at random. What is the probability that at least one of them will be…arrow_forward
- 6. In the book Business Research Methods (5th ed.), Donald R. Cooper and C. William Emory discuss studying the relationship between on-the-job accidents and smoking. Cooper and Emory describe the study as follows: Suppose a manager implementing a smoke-free workplace policy is interested in whether smoking affects worker accidents. Since the company has complete reports of on-the-job accidents, she draws a sample of names of workers who were involved in accidents during the last year. A similar sample from among workers who had no reported accidents in the last year is drawn. She interviews members of both groups to determine if they are smokers or not. The sample results are given in the following table.arrow_forwardAn automotive engineer is investigating two different types of metering devices for an electronic fuel injection system to determine whether they differ in their fuel mileage performance. The system is installed on 10 different cars, and a test is run with each metering device on each car. The data is provided below: Metering Device Car 1 2 1 17.6 16.8 2 19.4 20.0 3 18.2 17.6 4 17.1 16.4 5 15.3 16.0 6 15.9 15.9 7 16.3 16.5 8 18.0 18.4 9 17.3 16.4 10 19.1 20.1 Is there a significant difference between the means of the two metering devices? Use . Interpret the result in the context of the problem. An article in the journal Hazardous Waste and Hazardous Materials (Vol. 6, 1989) reported the results of an analysis of the weight of calcium in standard cement and cement doped with lead. Reduced levels of calcium would indicate that the hydration mechanism in the cement is blocked…arrow_forwardBetter Traffic Flow Exercise 2.155 introduces the dataset TrafficFlow, which gives delay time in seconds for 24 simulation runs in Dresden, Germany, comparing the current timed traffic light system on each run to a proposed flexible traffic light system in which lights communicate traffic flow information to neighboring lights. On average, public transportation was delayed 105 seconds under the timed system and 44 seconds under the flexible system. Since this is a matched pairs experiment, we are interested in the difference in times between the two methods for each of the 24 simulations. For the n = 24 differences D, we saw in Exercise 2.155 that x‾D=61 seconds with sD = 15.19 seconds. We wish to estimate the average time savings for public transportation on this stretch of road if the city of Dresden moves to the new system. d) If we create a bootstrap distribution using many of these bootstrap statistics, what shape do we expect it to have and where do we expect it to be…arrow_forward
- Better Traffic Flow Exercise 2.155 introduces the dataset TrafficFlow, which gives delay time in seconds for 24 simulation runs in Dresden, Germany, comparing the current timed traffic light system on each run to a proposed flexible traffic light system in which lights communicate traffic flow information to neighboring lights. On average, public transportation was delayed 105 seconds under the timed system and 44 seconds under the flexible system. Since this is a matched pairs experiment, we are interested in the difference in times between the two methods for each of the 24 simulations. For the n = 24 differences D, we saw in Exercise 2.155 that x‾D=61 seconds with sD = 15.19 seconds. We wish to estimate the average time savings for public transportation on this stretch of road if the city of Dresden moves to the new system. (a) What parameter are we estimating? Give correct notation. (b) Suppose that we write the 24 differences on 24 slips of paper. Describe how to…arrow_forwardSleep apnea is a disorder characterized by pauses in breathing during sleep. Children who suffer from untreated sleep apnea often have behavior problems, including hyperactivity, inattention, and aggression. A common treatment for pediatric sleep apnea is the surgical removal of enlarged tonsils and adenoids that are obstructing the airways. Suppose researchers at a sleep clinic are interested in the effect of surgical treatment for pediatric sleep apnea on aggressive behavior. They study 11 children without sleep apnea, 11 children with untreated sleep apnea, and 11 children who have been surgically treated for sleep apnea. Aggression is measured using the Conners Rating Scales. The sample means and sums of squares of the scores for each of the three groups are presented in the following table. Group Sample Mean Sum of Squares No Sleep Apnea 0.59 0.3240 Untreated Sleep Apnea 0.45 0.4410 Treated Sleep Apnea 0.31 0.2250 The researchers perform an analysis of…arrow_forwardBased on a survey of 12,344 U.S. college students and 6,729 Canadian college students, Kuo, Adlaf, Lee, Gliksman, Demers, and Wechsler (2002) report that alcohol use is more common among Canadian than U.S. students, but heavy drinking (five or more drinks in a row for males, four or more for females) is significantly higher among U.S. students than Canadian students. Is this an example of a survey research design?arrow_forward
 MATLAB: An Introduction with ApplicationsStatisticsISBN:9781119256830Author:Amos GilatPublisher:John Wiley & Sons Inc
 Probability and Statistics for Engineering and th...StatisticsISBN:9781305251809Author:Jay L. DevorePublisher:Cengage Learning
 Statistics for The Behavioral Sciences (MindTap C...StatisticsISBN:9781305504912Author:Frederick J Gravetter, Larry B. WallnauPublisher:Cengage Learning
 Elementary Statistics: Picturing the World (7th E...StatisticsISBN:9780134683416Author:Ron Larson, Betsy FarberPublisher:PEARSON
 The Basic Practice of StatisticsStatisticsISBN:9781319042578Author:David S. Moore, William I. Notz, Michael A. FlignerPublisher:W. H. Freeman
 Introduction to the Practice of StatisticsStatisticsISBN:9781319013387Author:David S. Moore, George P. McCabe, Bruce A. CraigPublisher:W. H. Freeman