
Concept explainers
Videos
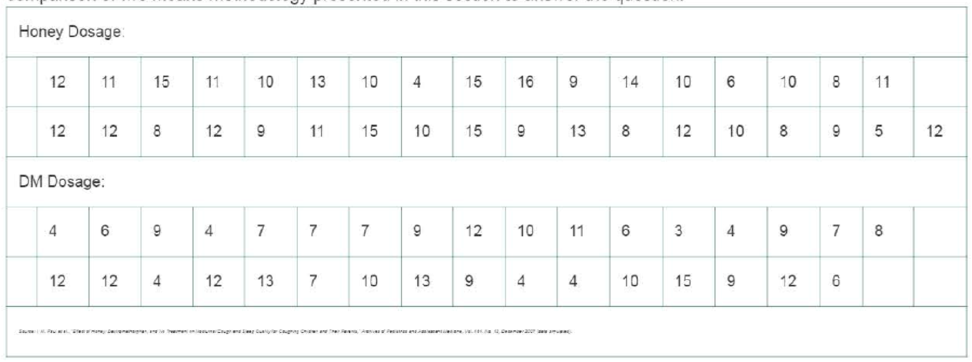
Is honey a cough remedy? Refer to the Archives of Pediatrics and Adolescent Medicine (Dec. 2007) study of honey as a children’s cough remedy. Exercise 2.31 (p. 62). Children who were ill with an upper respiratory tract infection and their parents participated in the study. Parents were instructed to give their sick child a dosage of liquid “medicine” prior to bedtime. Unknown to the parents, some were given a dosage of dextromethorphan (DM)—an over-the-counter cough medicine—while others were given a similar dose of honey. (Note: A third group gave their children no medicine.) Parents then rated their children’s cough symptoms, and the improvement in total cough symptoms score was determined for each child. The data (improvement scores) for the 35 children in the DM dosage group and the 35 children in the honey dosage group are reproduced in the next table. Do you agree with the statement (extracted from the article), “Honey may be a preferable treatment for the cough and sleep difficulty associated with childhood upper respiratory tract infection”? Use the comparison of two
Want to see the full answer?
Check out a sample textbook solution
Chapter 8 Solutions
STATISTICSMYSTAT LAB ACCESS CODE + PHS


- Peanut Allergies. In the article “Food Allergy Advice May Be Peanuts” (Science News, Vol. 174, No. 12, pp. 8–9), N. Seppa reports that early exposure to peanuts seems to lessen the risk of nut allergy. Of 4000 Jewish children sampled in Britain, 1.85% had peanut allergies; and of 4600 Jewish children sampled in Israel, where early peanut consumption is more common, 0.17% had peanut allergies. The researcher chose Jewish children in both countries to limit genetic differences between groups. a. Is this study descriptive or inferential? b. Is this study observational or experimental?arrow_forwardThe NAEP considers that a national average of 283 is an acceptable performance. Using α = .05, run a two-tail t-test for one sample to test Ho: µ=283 for the 2019 scores. Report the t-obt, df, and p-values. Would you reject the null hypothesis that the 2019 scores come from a population with average 283? If this is the case, does it come from a population from larger or smaller average?arrow_forwardA low-level CDC bureaucrat wants to please his boss by gathering evidence thatthe current government-mandated shutdown of society is not causing people’s mentalhealth to deteriorate, so that it can safely be continued for several years if anyexpert says it’s necessary.He polls a random sample of 1600 citizens, gathering data on such items asincome loss, weight gain, access to toilet paper, hours spent binge-watchingNetflix, and number of injuries caused by household fights, and compiles all thisinto a scientifically-weighted “misery index”.The mean misery index from the sample is 99.2; it seems reasonable to use apopulation standard deviation σ = 19.1.a) Does this information provide significant evidence (at the 5% level) that thenationwide mean misery index is less than 100? Set up appropriate null andalternative hypotheses, calculate the appropriate test statistic, find the P-value,and state your conclusion. (10)b) A CDC press release publishing the results of this study claims that…arrow_forward
- A low-level CDC bureaucrat wants to please his boss by gathering evidence thatthe current government-mandated shutdown of society is not causing people’s mentalhealth to deteriorate, so that it can safely be continued for several years if anyexpert says it’s necessary.He polls a random sample of 1600 citizens, gathering data on such items asincome loss, weight gain, access to toilet paper, hours spent binge-watchingNetflix, and number of injuries caused by household fights, and compiles all thisinto a scientifically-weighted “misery index”.The mean misery index from the sample is 99.2; it seems reasonable to use apopulation standard deviation σ = 19.1.a) Does this information provide significant evidence (at the 5% level) that thenationwide mean misery index is less than 100? Set up appropriate null andalternative hypotheses, calculate the appropriate test statistic, find the P-value,and state your conclusion. b) A CDC press release publishing the results of this study claims that…arrow_forwardIn 2010, Seery, Holman, & Silver found that individuals with some history of adversity report better mental health and well-being compared to people with little to no history of adversity. In an attempt to examine this phenomenon, a researcher surveys a group of college students to determine the negative life events they experienced in the last 5 years and their current feeling of well-being. Participants: With 5-10 negative experiences With 2 or fewer negative experiences n=7 n=7 Well-being score of M=48 Well-being score of M=41 SS=325 SS=347 1. State the hypotheses both experimental and statistical 2. Do the results indicate significantly different reports of Well-being? Use a two-tailed test with a=.05. Please show work and state your decision regarding the H0. 3. Compute the estimated Cohen's d to measure the size of the effect. State…arrow_forwardThe popular show 13 Reasons Why is organized around the suicide of the 17-year-old Hannah, In the show, Hannah herself describes reasons why she decided to kill herself. One of the early episodes originally depicted her suicide in graphic detail. Some critics and mental health advocates argued that the series represented suicide irresponsibly and worried that the show would lead to copycat suicides or self-harm. To test the effect of the show, Niederkrotenthaler et al. (2019) first used social media to determine the exact months of the year when the show was being discussed. They found that public attention was highest during April 2017. What type of design did they use? Group of answer choices Interrupted time-series design Nonequivalent control group posttest-only design Quasi-independent variable None of the abovearrow_forward
- Suppose a researcher is interested inthe effectiveness in a new childhood exercise program implemented in a SRS of schools across a particular county. In order to test the hypothesis that the new program decreases BMI (Kg/m2), the researcher takes a SRS of children from schools where the program is employed and a SRS from schools that do not employ the program and compares the results. Assume the following table represents the SRSs of students and their BMIs. Student intervention group BMI (kg/m2) Student control group BMI (kg/m2) A 18.6 A 21.6 B 18.2 B 18.9 C 19.5 C 19.4 D 18.9 D 22.6 E 24.1 F 23.6 A) Assuming that all the necessary conditions are met (normality, independence, etc.) carry out the appropriate statistical test to determine if the new exercise program is effective. Use an alpha level of 0.05. Do not assume equal variances.B) Construct a 95% confidence interval about your estimate for the average difference in BMI between the groups.arrow_forwardBased on information from a previous study, r1 = 38 people out of a random sample of n1 = 105 adult Americans who did not attend college believe in extraterrestrials. However, out of a random sample of n2 = 105 adult Americans who did attend college, r2 = 49 claim that they believe in extraterrestrials. Does this indicate that the proportion of people who attended college and who believe in extraterrestrials is higher than the proportion who did not attend college? Use α = 0.01. 1. What is the value of the sample test statistic? (Test the difference p1 − p2. Do not use rounded values. Round your final answer to two decimal places.) 2. Find (or estimate) the P-value. (Round your answer to four decimal places.)arrow_forwardBiostatistics Outpatients (N = 36) with type 2 diabetes were referred back to the hospital because of the risk of developing chronic kidney disease (CKD) (possible kidney failure). During their follow-up, some patients were diagnosed with advanced (or end-stage) CKD, requiring an extension of their stay in the hospital, while others were readmitted for further medical assessment. Throughout the study, mortality and hospitalization rates, as well as bio-chemical lab test results, were reported. In addition, the attached data slice contains additional demographic data about the patient group. Q1: Write demographic and lifestyle summary with appropriate statistical tools of descriptive statistics that include Age(years), Gender, Level of deprivation [Townsend or socio-economical status SES], and Marital status.arrow_forward
 Holt Mcdougal Larson Pre-algebra: Student Edition...AlgebraISBN:9780547587776Author:HOLT MCDOUGALPublisher:HOLT MCDOUGAL
 Glencoe Algebra 1, Student Edition, 9780079039897...AlgebraISBN:9780079039897Author:CarterPublisher:McGraw Hill