
Concept explainers
Videos
(a)
Interpretation:
Tetramethylsilane which is used as an internal standard needs to be explained.
Concept Introduction :
In
(a)
Answer to Problem 1E
In NMR studies, the TMS is largely considered as reference substances as it gives a single strong peak which lies outside the range of most of the sample substances used.
Explanation of Solution
In NMR studies, there is a common internal standard used, namely TMS, which is volatile liquid and signals of this compound is known. The TMS gives a strong peak as it has a large number of protons. In other words, this compound has 12 protons which are all equivalent and 4 carbons which are also equivalent. Due to this aspect, it will give a strong signal that would be outside the range of most signals in the spectrum. Moreover, TMS is considered as reference substance as
- The peak of this obtained was mostly found outside the spectral region which can be identified.
- It does not react with most of the samples as it is inert.
- It can be used as any solvent.
- It produces chemical shifts which depend on temperature and concentration.
- It can be used as single phase method.
(b)
Interpretation:
The delta (() scale needs to be defined.
Concept Introduction :
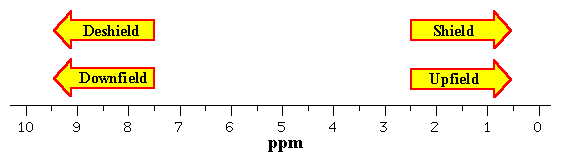
In NMR, the display of spectra consists of applied frequency versus the absorption. As the plot moves from left to right, there is increase in applied frequency indicating that there is presence of low field on the left side of the plot and on the right sides shows the presence of high field. In the plot, the position where the nuclei absorbs is said to be the chemical shift.
(b)
Answer to Problem 1E
The x-axis of the NMR spectrum is termed as delta scale where it shows the resonance position of each nucleus that is relative to standard TMS and is expressed in ppm.
Explanation of Solution
In NMR studies, the spectrum obtained is a plot depicting the radio frequency against the absorption. The signal obtained in the spectrum is termed as resonance while the frequency of this signal is called as chemical shift or delta. The chemical shift is defined as the frequency of the resonance expressed with reference to standard compound and is said to be 0 ppm.
The scale of measurement is expressed as parts per million or ppm and hence this scale is called as delta scale. It is expressed by:
The scale is independent of the frequency of spectrometer.
Of the NMR spectrum, the x-axis is called the delta scale where it indicates the resonance position of each nucleus in relation to the standard TMS.
(c)
Interpretation:
The upfield shift needs to be explained.
Concept Introduction :
The NMR spectrum consists of applied frequency versus the absorption. It is seen that there is an increase in applied frequency when moving from left to right indicating of a low field on the left side of the plot while there is a high field when on the right side. The signal of the spectrum is the resonance of the nuclei and the frequency of signal is chemical shift, delta.
(c)
Answer to Problem 1E
The x-axis of the NMR spectrum is termed as delta scale where it shows the resonance position of each nucleus that is relative to standard TMS and is expressed in ppm.
Explanation of Solution
The frequency of resonance which is expressed with reference to standard compound is termed chemical shift and the scale is expressed in ppm that is independent of spectrometer frequency. The relative positions of the resonances in the spectrum help to define the upfield or downfield positions. The peak at positions less than 5pp are said to be upfield with respect to the peak at 10ppm.
 |
(d)
Interpretation:
The n+1 rule needs to be explained with example.
Concept Introduction :
In NMR spectroscopy, the NMR signals can split up to two or more signals that are closely packed which is due to spin-spin coupling.
(d)
Answer to Problem 1E
The NMR signal in the first order which has ‘n’ neighbors happens in such a way that it splits to ‘n+1’ signals which area closely found.
Explanation of Solution
The (n+1) rule in NMR studies, is an empirical rule to predict the splitting pattern of peaks.
This rule states that if a nucleus is coupled to have ‘n’ nuclei the signals splits to ‘n+1’ peaks.
For example, take CH3Cl depicted as
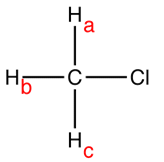
The hydrogen nuclei namely Ha, Hb, Hc are equivalent and hence for 1 H NMR spectrum there is one peak for Ha. But the hydrogen nuclei is HaHa, HbHb and HcHc and not linked to any hydrogen nuclei. Hence, n=0; therefore for n+1= 0+1 =1. Therefore, the multiplicity peak is on or in other the peak is a singlet.
(e)
Interpretation:
The chemical shift needs to be defined.
Concept Introduction :
In NMR spectroscopy, the nucleus under study will display a resonating frequency and if it is considered relative to the standard frequency in magnetic field, it is termed as chemical shift. The structure of molecule will decide the position and number of chemical shifts.
(e)
Answer to Problem 1E
The chemical shift is created when there is variation in the nuclear magnetic resonance frequency of the same nucleus.
Explanation of Solution
Each nucleus has its own nuclear spin that gives rise to various energy levels and it displays various resonance frequencies in magnetic field. Hence, in a nucleus, the magnetic fields of electrons in molecular orbitals will sum up to give the total magnetic field. The geometry of the nucleus decides the electron distribution which is dependent on bond lengths and the angles between the bonds. When there is variation in nuclear magnetic resonance frequency due to the variation in distribution of electrons of the same nucleus, it is referred to as chemical shift.
The chemical shift is helpful to study the
(f)
Interpretation:
The integration curve needs to be explained.
Concept Introduction :
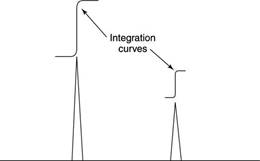
The NMR spectrum consists of various peaks and measurement of these peaks is integration. It signifies the amount of energy that is absorbed or released by nuclei which participates in chemical shift. It also helps to determine the ratio of hydrogens corresponding to signal.
(f)
Answer to Problem 1E
In NMR spectrum, the peaks of the curve are measured which is considered as integration curves. The height of the peak denotes the number of hydrogen nuclei.
Explanation of Solution
In NMR spectrum, there are various peaks obtained. The area under the NMR resonance curve denoted the number of hydrogen that resonates. By considering the measurements of different NMR resonances, it is possible to denote or identify hydrogen distinctly. The peak intensities are depicted by the integration curves and area under these curves is related to the number of hydrogen. While considering the curve, the height of the curve is proportional to the area under the peak and hence height of peak is proportional to number of hydrogens present. The width of the curve does nto have any significance.
(g)
Interpretation:
The relative ratio of integrated peaks needs to be explained.
Concept Introduction :
The various peaks in NMR spectrum can be measured and the measurement of these peaks is integration. Here the amount of energy that is absorbed or released by nuclei that participates in chemical shift is denoted. It also helps to determine the ratio of hydrogens corresponding to signal.
(g)
Answer to Problem 1E
In NMR spectrum, the integration curve denotes the number of hydrogen nuclei. The peaks denotes the hydrogen nucleus present. The division of the heights of the peak by the smallest height gives the relative ratio.
Explanation of Solution
The integrated intensity of a signal in NMR spectrum gives ratio of number of hydrogen. The signal obtained is measured and through the measurement, it is possible to depict the total number of hydrogen present in the sample. As there are different peaks obtained, each of them measured in terms of heights are compared with each other. The height of one is divided by the other to give the ratio. This is termed as relative ratio of integration curve.
For instance, if height of one peak is 16mm and other as 15mm. The smallest height is divided on both sides and the relative ratio is depicted as 1: 1.07.
(h)
Interpretation:
The absolute ratio of integrated peaks needs to be explained.
Concept Introduction :
The various peaks in NMR spectrum can be measured and the measurement of these peaks is integration. The amount of energy absorbed or released by nuclei which participates in chemical shift is denoted that helps to determine the ratio of hydrogens which corresponds to signal.
The peaks in NMR denotes the number of hydrogen present.
(h)
Answer to Problem 1E
In NMR spectrum, the peaks of the curve are measured which is considered as integration curves. The height of the peak denotes the number of hydrogen nuclei.
Explanation of Solution
In NMR spectrum, the peaks of spectrum denote the number of hydrogen atoms in molecule but this number is only a relative figure as it is a ratio. It does not give the exact number of hydrogen atoms. From the peak, it is known that larger peak has more number of hydrogen atoms but it does not indicate the actual number of hydrogen atoms.
To know the correct number of hydrogen atoms, it is to be compared with the molecular formula. If it matches, then it indicates the exact number of hydrogen atoms.
(i)
Interpretation:
The homotopic hydrogen atoms needs to be explained.
Concept Introduction :
In stereochemistry, the relation between the substituents and structure of the atoms to which it is attached is termed as topicity. Depending on the groups attached, it could be homotopic and enantiotopic and diasteriotopic. Homotopic means the at
(i)
Answer to Problem 1E
The homotopic hydrogen atoms are those which are identical to each other and have the same stereochemistry even after it is replaced with another atom.
Explanation of Solution
Generally homotopic groups are those that have the same molecules which have stereochemical the same. In case the molecule is replaced with another atom it will not change the remaining part of the molecules. It remains fixed.
Therefore, homotopic hydrogen atoms are those which are identical in any environment. This implies that it has the same chemical shift in the NMR.
Consider example of methane that has 4 hydrogen atoms and are homotopic. If the two hydrogen are replaced with two chlorine atoms, the molecule remains the same and has the same stereochemistry.
(j)
Interpretation:
The enantiotopic hydrogen atoms needs to be explained.
Concept Introduction :
In stereochemistry, the relation between the substituents and structure of the atoms to which it is attached is termed as topicity. Depending on the groups attached, it could be homotopic and enantiotopic and diasteriotopic. The enantiotopic atoms are mostly mirror images of the other about the plane of symmetry. But this symmetry gets removed if it is in chiral environment.
(j)
Answer to Problem 1E
The enantiotopic hydrogen atoms are those which are identical and indistinguishable except in chiral environment. These atoms are mirror image of each other about its plane of symmetry. The NMR spectrum produces a single peak.
Explanation of Solution
If one of the two groups in a molecule is replaced with another atom and it generates chiral compound, then the resulting compound is an enantiotopic molecule. Consider butane and if one hydrogen is replaced by Bromine, then the resulting compounds formed are enantiomers as the compounds generated are chiral.
 |  |  |
| Butane | ( R )-2-bromobutane | ( S )-2-bromobutane |
In the first figure, the two hydrogen atoms attached to the butane are enantiotopic hydrogen atoms.
The enantiotopic hydrogen atoms are those which are identical and indistinguishable except in chiral environment. These atoms are mirror image of each other about its plane of symmetry and is attached to the same atom. In NMR it produces a single peak.
(k)
Interpretation:
The diastereotopic hydrogen atoms needs to be explained.
Concept Introduction :
In stereochemistry, the relation between the substituents and structure of the atoms to which it is attached is termed as topicity. Depending on the groups attached, it could be homotopic and enantiotopic and diasteriotopic. The diastereotopic groups are not mirror images of each other.
(k)
Answer to Problem 1E
The diasterotopic hydrogen atoms are those which if replaced will generate compounds which are diasteroisomers. These are always identical groups attached to the same group of atom in molecule which contains the one chiral centre.
Explanation of Solution
The diastereotopic groups are those which are not mirror images of each other about its plane of symmetry. The molecules are different but sometimes indistinguishable.
Hence, if two groups of molecule can be replaced by other molecules to generate compounds which are diasteroisomers. Consider the 2-bromobutane, the two hydrogen atoms are diastereotopic as replacement of 2 hydrogen atom generates the compounds (2S, 3R) 2,3 -dibromobutane and (2S,3S)-2,3-dibromobutane.
 |  |  |
| ( S )-2-bromobutane | ( 2S,3R )-2,3-dibromobutane | ( 2S,3S )-2,3-dibromobutane |
(l)
Interpretation:
The coupling constant needs to be explained.
Concept Introduction :
In NMR, coupling is the method wherein information related to bond distances and angles are depicted. Through coupling information on connectivity of chemical bonds can also be found. The measurement of the distance between the peaks indicates the magnitude of splitting effect and is referred to as coupling constant. It is measured in Hz.
(l)
Answer to Problem 1E
The difference between the two adjacent sub peaks in a split signal is termed as coupling constant.
Explanation of Solution
When two protons interact with each other, it causes splitting of the peaks. The space between these peaks is the same for the two protons and is referred to as coupling constant. It is denoted in Hz. Hence, coupling constant denotes the interaction between the pair of protons.
(m)
Interpretation:
The chemically equivalent protons needs to be explained.
Concept Introduction :
In NMR, the number of peaks are determined to signify the chemical and magnetic equivalence. Chemical equivalence relates to nuclei being attached in similar chemical environment Magnetic equivalence signifies nuclei which are arranged in space in similar way
(m)
Answer to Problem 1E
Chemically equivalent protons are those protons which are in the same environment and are identical. Due to this, the magnetic forces overlaps which in turn causes the overlapping of the signals in the spectrum as well.
Explanation of Solution
Not all the protons in the molecules have same resonance frequency. It varies due to the electronic environment that it inhabits.
Consider methyl acetate structure depicted below which shows two different sets of proton.
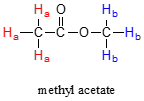
The protons marked in red and labelled as Ha has different resonance frequency than that marked in blue Hb. This is due to fact that two protons are situated in non-identical electronic environment. It can be seen that HaHa protons is linked to carbon atoms that is next to carbonyl carbon while the HbHb is linked to carbon next to oxygen atom. This indicates that all the HaHa protons are chemically equivalent to each other but non equivalent to HbHb. It means that their resonance frequencies don’t match with each other.
(n)
Interpretation:
The diamagnetic shielding needs to be explained.
Concept Introduction :
In most of the molecules, the protons are always surrounded by a cloud of charge which is due to the present of adjacent bonds or the atoms. When an external magnetic field is applied, electrons circulated and produce an induced field which opposes this field. Hence, the effective field obtained is said to be diamagnetic shielding.
(n)
Answer to Problem 1E
Diamagnetic shielding is the effect of induced field that opposes the existing magnetic field.
Explanation of Solution
When a nucleus experiences a weaker magnetic field, it is said ot be having a shielding effect. In NMR, there is a chemical shift displayed which indicates the relation between the resonance frequency to the magnetic field. The protons are often surrounded by cloud of charges which is due to the presence of bonds and atom that adjacent to it. The circulating electrons produce an induced magnetic field which opposes the applied field.
(o)
Interpretation:
The heterotopic hydrogen atoms needs to be explained.
Concept Introduction :
In stereochemistry, the relationship between the substituents and the structure of atoms is termed as topicity. Based on the relationships between the atoms, it is divided as homotopic, heterotopic, enantiotopic or diastereotopic.
(o)
Answer to Problem 1E
Heterotopic hydrogen atoms are those which are bonded differently to the molecule but have same molecular formula.
Explanation of Solution
Consider two
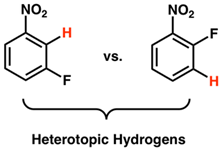 |
Want to see more full solutions like this?
Chapter 8 Solutions
EBK EXPERIMENTAL ORGANIC CHEMISTRY: A M


- What is the chemical shiftSplitting pattern Integration from this HnMRarrow_forwardWhy KBr used in IR spectroscopic sample preparation? Please shortly answer at your own words. Answer should be to the point (Specific 2-3 lines).arrow_forwardFill the blank below for 1H' NMR of Triphenylmethanol Chemical shift (ppm) Peak Integration Splitting Pattern # of Hydrogens Assignment Percentagearrow_forward
- Draw the fragmented molecular ion for the compound shown above for peaks 127,144 and 159. Thank you.arrow_forward(a) Three components in a mixture have varying distribution constants between the mobile phase and the stationary phase. One of the components has a very high distribution constant. Would this component likely elute first or last and how would you design an experiment or modify the components of the separation to make it perform in the opposite manner? (b) One way to dramatically increase the sensitivity of a quadrupole mass spectrometer is to use a technique called selected ion monitoring (SIM). Explain how this technique works and why it improves sensitivity. Explain what dwell time means. Be sure to draw a diagram and describe how this analysis scheme works. Also, is there a compromise between a wide range of masses scanned and SIM? Explain in easy details.arrow_forward6. A sample of an alum was analysed by atomic spectroscopy and gravimetrically to determine its structure. A 0.1000 g of the sample when treated with BaCl₂ produced 0.0984 g of a white solid after drying to constant weight. Another 0.1000 g sample of the alum when heated at 105°C for several hours produced a weight loss of 0.04558 g while the % of K in the sample was determined by atomic spectroscopy to be 8.240%. Use these results to work out a formula for the alum. [M,/ g mole¹: K 39.10; Al 26.98; BaSO, 233.39; SO² 96.06; H₂O 18.0148]arrow_forward
- Fill the graph for 1H' NMR of Benzophenone Chemical Shift (ppm) Peak Integration Splitting Pattern # of Hydrogens Assignment Percentagearrow_forwardChemistry Could you please find out the Hydrogen number, Multiplet and 1H Chemical Shift/ppm using this NMR Spectra and give explanation for the same asap. Thanksarrow_forwarda) What resolution is needed to separate the ions C2H4 + and CH2N+ with masses of 28.0313 and 28.0187 respectively? b) What mass difference can just be resolved at m value of 1000 if the mass spectrometer has a resolution of 3000? c) Calculate the ratios (M+2) to M+ peak heights for the following two compounds C10H6Br2 and C3H7ClBrarrow_forward
- Based on the chromatograms, Symmetry C18 (top) is less selective than Symmetry Shield RP18 (bottom) for the analytes given, true or false?arrow_forwarduse software to make 1H-NMR and 13C-NMR from the data in the paper and make a table with the following data 1H: chemical shift , multiplet structure, integration, assignment 13C: chemical shiftarrow_forwardWhy inherent sensitivity of an NMR experiment is proportional to B02. Explain the origin of this dependence!arrow_forward
 Principles of Instrumental AnalysisChemistryISBN:9781305577213Author:Douglas A. Skoog, F. James Holler, Stanley R. CrouchPublisher:Cengage Learning