
Videos
Vermont maple sugar producers sponsored a testing program to determine the benefit of a potential new fertilizer regimen. A random sample of 27 maple trees in Vermont were chosen and treated with one of three levels of fertilizer suggested by the chemical producer. In this experimental setup, nine trees (three in each of three climatic zones) were treated with each fertilizer level and the amount of sap produced (in mL) by the trees in the subsequent season was measured. The results are presented in the following table.
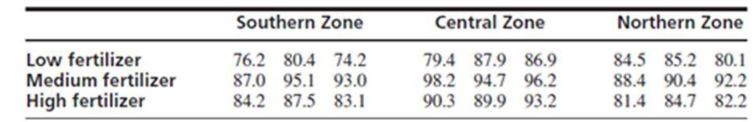
- a. Estimate the main effects of fertilizer levels and climatic zone, and their interactions.
- b. Construct an ANOVA table. You may give
ranges for the P-values. - c. Test the hypothesis that there is no interaction between fertilizer levels and climatic zone.
- d. Test the hypothesis that there is no difference in sap production for the three fertilizer levels.
Want to see the full answer?
Check out a sample textbook solution
Chapter 9 Solutions
Statistics for Engineers and Scientists
Additional Math Textbook Solutions
STATISTICS F/BUSINESS+ECONOMICS-TEXT
PRACTICE OF STATISTICS F/AP EXAM
Statistics for Psychology
Essentials of Statistics (6th Edition)
Essentials of Statistics, Books a la Carte Edition (5th Edition)
An Introduction to Mathematical Statistics and Its Applications (6th Edition)


- A consumer group is investigating a producer of diet meals to examine if its prepackaged meals actually contain the advertised 6 ounces of protein in each package. Based on the following data, is there any evidence that the meals do not contain the advertised amount of protein? Run the appropriate test at a 5% level ofarrow_forwardA deficiency of the trace element selenium in the diet can negatively impact growth, immunity, muscle and neuromuscular function, and fertility. The introduction of selenium supplements to dairy cows is justified when pastures have low selenium levels. Authors of a research paper supplied the following data on milk selenium concentration (mg/L) for a sample of cows given a selenium supplement (the treatment group) and a control sample given no supplement, both initially and after a 9-day period. Initial Measurement Treatment Control 11.2 9.1 9.6 8.7 10.1 9.7 8.5 10.8 10.3 10.9 10.6 10.6 11.7 10.1 9.7 12.3 10.8 8.8 10.3 10.4 10.4 10.9 11.2 10.4 9.4 11.6 10.6 10.9 10.7 8.4 After 9 Days Treatment Control 138.3 9.3 104 8.7 96.4 8.7 89 10.1 88 9.6 103.8 8.6 147.3 10.2 97.1 12.2 172.6 9.3 146.3 9.5 99 8.2 122.3 8.9 103 12.5 117.8 9.1 121.5 93 (a) Use the given data for the treatment group to determine if there…arrow_forwardA deficiency of the trace element selenium in the diet can negatively impact growth, immunity, muscle and neuromuscular function, and fertility. The introduction of selenium supplements to dairy cows is justified when pastures have low selenium levels. Authors of a research paper supplied the following data on milk selenium concentration (mg/L) for a sample of cows given a selenium supplement (the treatment group) and a control sample given no supplement, both initially and after a 9-day period. Initial Measurement Treatment Control 11.3 9.1 9.7 8.7 10.1 9.7 8.5 10.8 10.4 10.9 10.7 10.6 11.8 10.1 9.8 12.3 10.6 8.8 10.4 10.4 10.2 10.9 11.3 10.4 9.2 11.6 10.7 10.9 10.8 8.2 After 9 Days Treatment Control 138.3 9.4 104 8.8 96.4 8.8 89 10.1 88 9.7 103.8 8.7 147.3 10.3 97.1 12.3 172.6 9.4 146.3 9.5 99 8.3 122.3 8.9 103 12.5 117.8 9.1 121.5 93 (a) Use the given data for the treatment group to determine if…arrow_forward
- A deficiency of the trace element selenium in the diet can negatively impact growth, immunity, muscle and neuromuscular function, and fertility. The introduction of selenium supplements to dairy cows is justified when pastures have low selenium levels. Authors of a research paper supplied the following data on milk selenium concentration (mg/L) for a sample of cows given a selenium supplement (the treatment group) and a control sample given no supplement, both initially and after a 9-day period. Initial Measurement Treatment Control 11.4 9.1 9.6 8.7 10.1 9.7 8.5 10.8 10.2 10.9 10.6 10.6 11.9 10.1 9.9 12.3 10.7 8.8 10.2 10.4 10.3 10.9 11.4 10.4 9.3 11.6 10.6 10.9 10.9 8.3 After 9 Days Treatment Control 138.3 9.2 104 8.9 96.4 8.9 89 10.1 88 9.6 103.8 8.6 147.3 10.4 97.1 12.4 172.6 9.2 146.3 9.5 99 8.4 122.3 8.8 103 12.5 117.8 9.1 121.5 93 (a) Use the given data for the treatment group to determine if…arrow_forwardPenicillin is produced by the Penicillin fungus, which is grown in a broth whose sugar content must be carefully controlled. Several samples of broth were taken on three successive days, and the amount of dissolved sugars, in milligrams per milliliter, was measured on each sample. The results were as follows. Day 1 : 4.9 5.4 5.3 4.9 5.2 5.1 5.4 4.9 5.1 5.1 4.9 5.4 Day 2 : 5.5 5.2 5.1 5.0 5.3 5.4 5.3 5.2 5.4 5.3 5.4 5.1 Day 3 : 5.8 5.0 5.4 5.5 5.5 5.5 4.8 5.5 5.2 4.9 5.5 5.0 Construct an ANOVA table. Round your answers to four decimal places as needed. One-way ANOVA: Sugar Concentration Source DF SS MS F P Days Error Total Is there enough evidence to conclude that the mean sugar concentration…arrow_forwardResearchers interested in lead exposure due to car exhaust sampled the blood of 52 police officers subjected to constant inhalation of automobile exhaust fumes while working traffic enforcement in a primarily urban environment. The blood samples of these officers had an average lead concentration of 124.32 µg/l and an SD of 37.74 µg/l; a previous study of individuals from a nearby suburb, with no history of exposure, found an average blood level concentration of 35 µg/l. Write down the hypotheses that would be appropriate for testing if the police officers appear to have been exposed to a higher concentration of lead. Explicitly state and check all conditions necessary for inference on these data. Test the hypothesis that the downtown police officers have a higher lead exposure than the group in the previous study. Interpret your results in context. Based on your preceding result, without performing a calculation, would a 99% confidence interval for the average blood concentration…arrow_forward
- Life-saving drug: Penicillin is produced by the Penicillin fungus, which is grown in a broth whose sugar content must be carefully controlled. Several samples of broth were taken on three successive days, and the amount of dissolved sugars, in milligrams per milliliter, was measured on each sample. The results were as follows. Day 1: 5.2 5.0 5.4 5.2 5.3 5.0 4.9 5.0 5.2 5.0 4.6 5.3 Day 2: 5.6 4.8 4.9 5.3 5.2 4.9 5.4 5.0 5.4 4.9 5.5 5.4 Day 3: 5.9 4.9 5.3 5.4 5.2 5.5 5.0 5.8 5.5 5.4 5.4 5.1 Construct an ANOVA table. Round your answers to four decimal places as needed. One-way ANOVA: Sugar Concentration Source DF SS MS F P Days Error Totalarrow_forwardLife-saving drug: Penicillin is produced by the Penicillin fungus, which is grown in a broth whose sugar content must be carefully controlled. Several samples of broth were taken on three successive days, and the amount of dissolved sugars, in milligrams per milliliter, was measured on each sample. The results were as follows.arrow_forwardNatalie conducted a study on the effects of triclosan on three algae populations. She collected an algae sample from three different ponds, counted the number of algae cells present in the sample, and then exposed them to a 5 ppm aqueous solution of triclosan and re-counted the number of algae cells in each sample. Using a paired t-test, she obtained a p-value of 0.083 when comparing the original algae population sizes to the population sizes after exposure to triclosan. Natalie concluded that triclosan is toxic to algae because her data for the three samples showed a trend toward a reduction in population size. What could Natalie do to show a statistically significant effect of triclosan on algae population size? Justify your response.arrow_forward
- A pharmaceutical company wants to know whether an experimental drug has an effect on systolic blood pressure. Fifteen randomly selected subjects were given the drug and, after sufficient time for the drug to have an impact, their systolic blood pressures were recorded. The data appear below: 172140123130115 148108129137161 123152133128142172140123130115 148108129137161 123152133128142 Calculate the values of y¯¯¯y¯ and s for the 15 blood pressure readings.arrow_forwardIn a test of H0: p = 0.4 against H1: p ≠ 0.4, a sample of size 100 produces Z = 1.28 for the value of the test statistic. Thus the p-value (or observed level of significance) of the test is approximately equal to:arrow_forwardA study assessed the lung destructive index among smokers and non- smokers provided the following data Smokers : overline x 1 =14.5 n 1 =12 S P =2.50 Non- Smokers: overline x 2 =9.5 n 2 =10 a = .05 From the available data, can we conclude that smokers have greater lung damage than non-smokers?arrow_forward
 Glencoe Algebra 1, Student Edition, 9780079039897...AlgebraISBN:9780079039897Author:CarterPublisher:McGraw Hill