Videos
In the article “Nitrate Contamination of Alluvial Groundwaters in the Nakdong River Basin, Korea” (J. Min, S. Yun. et al., Geosciences Journal. 2002:35–46), several chemical properties were measured for water samples taken from irrigation wells at three locations. The following table presents the means, standard deviations, and sample sizes for pH measurements.
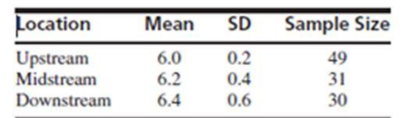
Do the data prove conclusively that the pH differs at the different locations?
Want to see the full answer?
Check out a sample textbook solution
Chapter 9 Solutions
Statistics for Engineers and Scientists
Additional Math Textbook Solutions
Statistics: The Art and Science of Learning from Data (4th Edition)
Elementary Statistics (13th Edition)
Elementary Statistics Using The Ti-83/84 Plus Calculator, Books A La Carte Edition (5th Edition)
STATS:DATA+MODELS-W/DVD
Statistics for Psychology
Elementary Statistics Using Excel (6th Edition)


- Three samples of each of three types of PVC pipe of equal wall thickness are tested to failure under three temperature conditions, yielding the results shown below. Research questions: Is mean burst strength affected by temperature and/or by pipe type? Is there a “best” brand of PVC pipe? Burst Strength of PVC Pipes (psi) Temperature PVC1 PVC2 PVC3 Hot (70º C) 247 299 239 277 287 262 283 275 279 Warm (40º C) 325 341 297 322 319 315 296 335 304 Cool (10º C) 358 375 327 366 352 334 338 359 340 Click here for the Excel Data File (a-1) Choose the correct row-effect hypotheses. a. H0: A1 ≠ A2 ≠ A3 ≠ 0 ⇐⇐ Temperature means differ H1: All the Aj are equal to zero ⇐⇐ Temperature means are the same b. H0: A1 = A2 = A3 = 0 ⇐⇐ Temperature means are the same H1: Not all the Aj are equal to zero ⇐⇐ Temperature means differ a b (a-2) Choose the correct column-effect hypotheses. a. H0: B1 ≠ B2 ≠ B3 ≠ 0 ⇐⇐…arrow_forwardThe article “Structural Performance of Rounded Dovetail Connections Under Different Loading Conditions” (T. Tannert, H. Prion, and F. Lam, Can J Civ Eng, 2007:1600–1605) describes a study of the deformation properties of dovetail joints. In one experiment, 10 rounded dovetail connections and 10 double rounded dovetail connections were loaded until failure. The rounded connections had an average load at failure of 8.27 kN with a standard deviation of 0.62 kN. The double-rounded connections had an average load at failure of 6.11 kN with a standard deviation of 1.31 kN. Can you conclude that the mean load at failure is greater for rounded connections than for double-rounded connections?arrow_forwardAn article reports the following values for soil heat flux of eight plots covered with coal dust. 37.9 37.8 37.9 35.1 35.5 27.5 18.3 24.1 The mean soil heat flux for plots covered only with grass is 29.0. Assuming that the heat-flux distribution is approximately normal, does the data suggest that the coal dust is effective in increasing the mean heat flux over that for grass? Test the appropriate hypotheses using ? = 0.05.State the appropriate hypotheses. H0: ? = 29Ha: ? > 29H0: ? = 29Ha: ? < 29 H0: ? = 29Ha: ? ≠ 29H0: ? ≠ 29Ha: ? = 29 Calculate the test statistic and determine the P-value. (Round your test statistic to two decimal places and your P-value to three decimal places.) t = P-value = State the conclusion in the problem context. Reject the null hypothesis. There is sufficient evidence to conclude that there was an increase in mean heat flux.Do not reject the null hypothesis. There is sufficient evidence to conclude that…arrow_forward
- Following is the rating of marketing aggressivity (X) and sales performance (Y) of 8 sales staffs in Glovis Co in the past year: Table Attached Question: What is the hypothesis of the study?arrow_forwardRecently, researchers have begun to focus on the relationship between potentially toxic environmental exposures in children to a number of adverse health outcomes. Suppose one such researcher wants to investigate the relationship between lead levels in soil (micrograms/dL) and BMI (kg/m2). The following table represents a SRS of households with the corresponding exterior lead levels and BMI of a randomly sampled child in the home. Lead levels BMI 13.6 19.7 14.3 19.9 9.7 20.1 9.4 22.1 11.4 19.8 10.9 21.6 A) Write out the null and alternative hypotheses for a formal test of significance testing the correlation between the two variables and calulate a t statistic and interpret your pvalue and results.arrow_forwardAn article reports the following values for soil heat flux of eight plots covered with coal dust. 37.3 36.8 37.3 32.1 33.4 26.5 18.1 24.8 The mean soil heat flux for plots covered only with grass is 29.0. Assuming that the heat-flux distribution is approximately normal, does the data suggest that the coal dust is effective in increasing the mean heat flux over that for grass? Test the appropriate hypotheses using α = 0.05. Calculate the test statistic and determine the P-value. (Round your test statistic to two decimal places and your P-value to three decimal places.) t = P-valuearrow_forward
- The article “Dynamics of Insulin Action in Hypertension: Assessment from Minimal ModelInterpretation of Intravenous Glucose Tolerance Test Data” (R. Burattini, M. Morettini, etal., Med Biol Eng Comput, 2011:831–841) compared levels of an insulin sensitivity index SIin patients with high blood pressure and patients with normal blood pressure. Ten patientswith high blood pressure had a mean value of 3.4 with a standard deviation of 0.6, and eightpatients with normal blood pressure had a mean value of 7.9 with a standard deviation of0.6. Units are 10−5 · min−1 · pmol−1. Find a 98% confidence interval for the difference inmean levels between those with high blood pressure and those with normal blood pressure.arrow_forwardthe assumption that the t test for independent samples makes regarding the amount of variability in each of the two groups is called the?arrow_forwardIn a bumper test, three test vehicles of each of three types of autos were crashed into a barrier at 5 mph, and the resulting damage was estimated. Crashes were from three angles: head-on, slanted, and rear-end. The results are shown below. Research questions: Is the mean repair cost affected by crash type and/or vehicle type? Are the observed effects (if any) large enough to be of practical importance (as opposed to statistical significance)? 5 mph Collision Damage ($) Crash Type Goliath Varmint Weasel Head-On 750 1,740 2,250 1,400 1,660 1,690 800 1,630 1,740 Slant 1,450 1,800 2,080 1,790 1,750 1,500 1,270 1,600 2,410 Rear-end 720 870 1,660 1,240 1,580 1,670 940 1,290 1,210 Click here for the Excel Data File (a-1) Choose the correct row-effect hypotheses. a. H0: A1 ≠ A2 ≠ A3 ≠ 0 ⇐⇐ Angle means differ H1: All the Aj are equal to zero ⇐⇐ Angle means are the same b. H0: A1 = A2 = A3 = 0 ⇐⇐ Angle means are the same H1:…arrow_forward
- In a bumper test, three test vehicles of each of three types of autos were crashed into a barrier at 5 mph, and the resulting damage was estimated. Crashes were from three angles: head-on, slanted, and rear-end. The results are shown below. Research questions: Is the mean repair cost affected by crash type and/or vehicle type? Are the observed effects (if any) large enough to be of practical importance (as opposed to statistical significance)? 5 mph Collision Damage ($) Crash Type Goliath Varmint Weasel Head-On 700 1,700 2,280 1,400 1,650 1,670 850 1,630 1,740 Slant 1,430 1,850 2,000 1,740 1,700 1,510 1,240 1,650 2,480 Rear-end 700 860 1,650 1,250 1,550 1,650 970 1,250 1,240 (d) Perform Tukey multiple comparison tests. (Input the mean values within the input boxes of the first row and input boxes of the first column. Round your t-values and critical values to 2 decimal places and other answers to 3 decimal places.) Post hoc analysis…arrow_forwardIn a bumper test, three test vehicles of each of three types of autos were crashed into a barrier at 5 mph, and the resulting damage was estimated. Crashes were from three angles: head-on, slanted, and rear-end. The results are shown below. Research questions: Is the mean repair cost affected by crash type and/or vehicle type? Are the observed effects (if any) large enough to be of practical importance (as opposed to statistical significance)? 5 mph Collision Damage ($) Crash Type Goliath Varmint Weasel Head-On 700 1,700 2,280 1,400 1,650 1,670 850 1,630 1,740 Slant 1,430 1,850 2,000 1,740 1,700 1,510 1,240 1,650 2,480 Rear-end 700 860 1,650 1,250 1,550 1,650 970 1,250 1,240 Click here for the Excel Data File (a-1) Choose the correct row-effect hypotheses. a. H0: A1 ≠ A2 ≠ A3 ≠ 0 ⇐⇐ Angle means differ H1: All the Aj are equal to zero ⇐⇐ Angle means are the same b. H0: A1 = A2 = A3 = 0 ⇐⇐ Angle means are the same H1:…arrow_forwardIn a bumper test, three test vehicles of each of three types of autos were crashed into a barrier at 5 mph, and the resulting damage was estimated. Crashes were from three angles: head-on, slanted, and rear-end. The results are shown below. Research questions: Is the mean repair cost affected by crash type and/or vehicle type? Are the observed effects (if any) large enough to be of practical importance (as opposed to statistical significance)? 5 mph Collision Damage ($) Crash Type Goliath Varmint Weasel Head-On 700 1,700 2,280 1,400 1,650 1,670 850 1,630 1,740 Slant 1,430 1,850 2,000 1,740 1,700 1,510 1,240 1,650 2,480 Rear-end 700 860 1,650 1,250 1,550 1,650 970 1,250 1,240 (d) Perform Tukey multiple comparison tests. (Input the mean values within the input boxes of the first row and input boxes of the first column. Round your t-values and critical values to 2 decimal places and other answers to 1 decimal place.) Post hoc analysis for…arrow_forward
 MATLAB: An Introduction with ApplicationsStatisticsISBN:9781119256830Author:Amos GilatPublisher:John Wiley & Sons Inc
 Probability and Statistics for Engineering and th...StatisticsISBN:9781305251809Author:Jay L. DevorePublisher:Cengage Learning
 Statistics for The Behavioral Sciences (MindTap C...StatisticsISBN:9781305504912Author:Frederick J Gravetter, Larry B. WallnauPublisher:Cengage Learning
 Elementary Statistics: Picturing the World (7th E...StatisticsISBN:9780134683416Author:Ron Larson, Betsy FarberPublisher:PEARSON
 The Basic Practice of StatisticsStatisticsISBN:9781319042578Author:David S. Moore, William I. Notz, Michael A. FlignerPublisher:W. H. Freeman
 Introduction to the Practice of StatisticsStatisticsISBN:9781319013387Author:David S. Moore, George P. McCabe, Bruce A. CraigPublisher:W. H. Freeman