Videos
The article “Case Study Based Instruction of DOE and SPC” (J. Brady and T. Allen, The American Statistician. 2002:312–315) presents the result of a 24–1 factorial expertment to investigate the effects of four factors on the yield of a process that manufactures printed circuit boards. The factors were A: transistor power output (upper or lower specification limit). B: transistor mounting approach (screwed or soldered). C: transistor heat sink type (current or alternative configuration), and D: screw position on the frequency adjustor (one-half or two turns). The results are presented in the following table. The yield is a percent of a theoretical maximum.
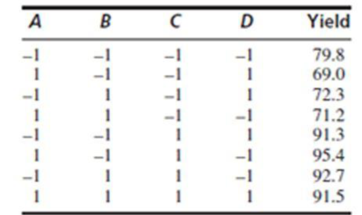
- a. Estimale the main effccts of cach of the four faetors.
- b. Assuming all intcractions to be negligible, pool the sums of squares for interaction to use in place of an error sum of squares.
- c. Which of the four factors, if any. con you conclude to affect the yield? Whal is the P-value of thè relevanl test?
Want to see the full answer?
Check out a sample textbook solution
Chapter 9 Solutions
Statistics for Engineers and Scientists
Additional Math Textbook Solutions
Statistics for Business & Economics, Revised (MindTap Course List)
Elementary Statistics Using The Ti-83/84 Plus Calculator, Books A La Carte Edition (5th Edition)
Introductory Statistics (2nd Edition)
Elementary Statistics Using the TI-83/84 Plus Calculator, Books a la Carte Edition (4th Edition)


- 19. A local brewery produces three premium lagers named Half Pint, XXX, and Dark Knight. Of its premium lagers, the brewery bottles 40% Half Pint, 40% XXX, and 20% Dark Knight. In a marketing test of a sample of 80 consumers, 26 preferred the Half Pint lager, 42 preferred the XXX lager, and 12 preferred the Dark Night lager. Using a chi-square goodness-of-fit test, test whether the production of the premium lagers matches these consumer preferences using a .05 level of significance.arrow_forwardIn low-speed crash tests of five cars, the repair costs were computed for a factory authorizedrepair and an independent repair workshop. The results are listed in Table 2. Is there sufficientevidence to support the claim that the independent workshop has lower repair costs? Use a 0.01significance level.Table 2 car 1 2 3 4 5 authorized repair centre X1 RM797 RM571 RM904 RM1147 RM418 independent workshop X2 RM523 RM488 RM875 RM911 RM297 D=X1 - X2 274 83 29 236 121 D2 = (X1 -X2)2 75076 6889 841 55696 14641arrow_forward1. In the book Design and Analysis of Experiments, 8th edition (2012, John Wiley & Sons), the results of an experiment involving a storage battery used in the launching mechanism of a shoulder-fired ground-to-air missile were presented. Three material types can be used to make the battery plates. The objective is to design a battery that is relatively unaffected by the ambient temperature. The output response from the battery is effective life in hours. Three temperature levels are selected, and a factorial experiment with four replicates is run. The data are as follows: Table 11.(a) Test the appropriate hypotheses and draw conclusions using the analysis ether either firing temperature or furnace position affects the baked density of a carbon anode. The data are as follows: Table 12.(a) State the hypotheses of interest. (b) Test the hypotheses in part (a) using the analysis of variance with a = 0.05. What are your conclusions? (c) Analyze the residuals from this experiment. (d)…arrow_forward
- Do the results of your hypothesis test provide evidence that penetration of Fuentes’ Candied Bacon Potato Chips in grocery stores differs across its eight U.S. sales regions? In which sales region(s) is penetration of Fuentes’ Candied Bacon Potato Chips lower or higher than expected? Use the Marascuilo pairwise comparison procedure at a 5 .05 to test for differences between regions. New England Mid-Atlantic Midwest Great Plains South Atlantic Deep South Mountain Pacific Yes Yes No No Yes Yes Yes No No Yes Yes Yes Yes Yes Yes No Yes Yes No Yes No Yes No No Yes No Yes Yes Yes Yes Yes No Yes Yes No Yes Yes Yes No Yes No No No Yes No Yes No No Yes Yes Yes Yes Yes Yes Yes No No Yes Yes No Yes No Yes Yes Yes No No No Yes Yes Yes Yes Yes No No Yes Yes Yes No No Yes Yes Yes Yes Yes Yes No Yes Yes No No Yes Yes No Yes No No Yes Yes Yes Yes Yes No No No Yes Yes Yes Yes Yes Yes Yes Yes Yes Yes Yes Yes Yes No Yes No Yes No No Yes Yes No No No Yes No Yes Yes…arrow_forwardA recent poll found that 664 out of 1026 randomly selected people in a particular country felt that colleges and universities with big sports programs placed too much emphasis on athletics over academics. Assuming the conditions for the CLT are met, use the accompanying Minitab output to complete parts a and b below. N Event Sample p 95% CI for p 1026 664 0.647173 (0.617934, 0.676413) Question content area bottom b. Suppose a sports blogger wrote an article claiming that a majority of adults from this country believe that colleges and universities with big sports programs place too much emphasis on athletics over academics. Does this confidence interval support the blogger's claim? Explain your reasoning. A. No, it is not a plausible claim because the confidence interval contains 50%. B. No, it is not a plausible claim because the confidence interval does not contain only values above 50%. C. Yes, it is a…arrow_forwardJensen Tire & Auto is in the process of deciding whether to purchase a maintenance contract for its new computer wheel alignment and balancing machine. Managers feel that maintenance expense should be related to usage, and they collected the following information on weekly usage (hours) and annual maintenance expense (in hundreds of dollars). Weekly Usage(hours) AnnualMaintenanceExpense 13 17.0 10 22.0 20 30.0 28 37.0 32 47.0 17 30.5 24 32.5 31 39.0 40 51.5 38 40.0 test statistic is 6.90 Find the p-value. (Round your answer to three decimal places.) p-value = State your conclusion. Reject H0. We conclude that the relationship between weekly usage (hours) and annual maintenance expense (in hundreds of dollars) is significant. Do not reject H0. We conclude that the relationship between weekly usage (hours) and annual maintenance expense (in hundreds of dollars) is significant. Reject H0. We cannot conclude that the relationship between weekly usage…arrow_forward
- In a study of a group of women science majors who remained in their profession and a group who left their profession within a few months of graduation, the researchers collected the data shown here on a self-esteem questionnaire. Leavers Stayers1 = 3.05 2 = 2.92σ1 = 0.71 σ2 = 0.71n1 = 100 n2 = 227At α = 0.05, can it be concluded that there is a difference in the self-esteem scores of the two groups? Use the P-value method.arrow_forwardA study was conducted to explore workplace bullying in a community NHS trust. Staff were asked about whether workplace bullying had affected their working environment (Quine L, BMJ 1999; 318: 228-229). Those who had been bullied had lower levels of job satisfaction (mean 10.5 [SD 2.7] vs 12.2 [2.3], P<0.001) and higher levels of job-induced stress (mean 22.5 [SD 6.1] v 16.9 [5.8], P<0.001) than those who had not been bullied. Based on the above info, Select which of the following statement(s) you believe to be true You CAN SELECT MORE THAN 1. a. The P value for the comparison of job-induced stress was less than 0.001. This means that we cannot reject the null hypothesis at the 5% level of significance. b. P < 0.001 means that there is a less than 1 in 1000 chance that we would have obtained these results, or more extreme results, if the alternative hypothesis was true. c. There is a significant difference in the levels of job satisfaction between…arrow_forwardA survey was administered to a sample of American college students. Data was gathered regarding their college major and their choice of writing utensil in completing the survey: Observed pen pencil marker crayon Totals ElemEd 16 12 6 9 43 HealthSci 14 8 14 7 43 DigitalMkt 7 6 11 18 42 Totals 37 26 31 34 128 Expected pen pencil marker crayon ElemEd 12.4 8.7 10.4 11.4 HealthSci 12.4 8.7 10.4 11.4 DigitalMkt 12.1 8.5 10.2 11.2 Chi-Squared pen pencil marker crayon ElemEd 1.03 1.22 1.87 0.51 HealthSci 0.20…arrow_forward
- In a breeding experiment, chicken with white feathers, small comb were mated and the offspring categories white feathers, small comb (WS), white feathers. large comb (WL), dark feathers, small comb (DS) and dark feathers, large comb (DL) were expected to follow the ratio 9:3:3:1 the researcher observed that there were 100 WS, 32 WL, 40 DS and 20 DL offspring. In order to test if the observed frequencies follow the expected ratio, what should be the hull hypothesis?A. P(WS) = 100/192, P(WL) = 32/192, P(DS) = 40/192 , P(DL) = 20/192 B. P(WS) = 100 , P(WL) = 32, P(DS) = 40, P(DL) = 20 C. P(WS) = 9/16 , P(WL) = 3/16, P(DS) = 3/16, P(DL) = 1/16 D. P(WS) = 9, P(WL) = 3, P(DS) = 3 , P(DL) = 1 2. In Problem 1, what would be the degree of freedom for an appropriate test?A.2 B.3 C.4 D.1 3. What is the value of the computed test statistic in problem 1? A.7.81 B.3.84 C.6.81 D.5.99 5.What would be the p-value for this test in problem 1? A.0.28 B.0.05 C.0.08 D. 0.11 6. At 5-% level of significance,…arrow_forwardDo well-rounded people get fewer colds? A study on the Chronicle of Higher Education was conducted by scientist at Carnegie Mellon University, the University of Pittsburgh and the University of Virginia. They found that people who have only a few social outlets get more colds than those who are involved in a variety of social activities. Suppose that of the 276 healthy men and women tested, n1=96 had only a few social outlets and n2=105 were busy with six or more activities. When these people were exposed to a cold virus, the following results were observed: Construct a 99% confidence interval for the difference in the two population proportions.arrow_forward1) A cement producer, manufactures and then fills 40kg-bags of powder cement on twodistinct production tracks located in separate suburbs. To determine whether differencesexist between the average fill rates for the two tracks, a random sample of 25 bags fromTrack 1 and a random sample of 16 bags from Track 2 were recently selected. Each bag’sweight was measured and the following information measures from the samples arereported:Production ProductionTrack 1 Track 2n1 = 25 n2 = 16x2 = 40.02 x1 = 39.87 s1 = 0.59 s2 = 0.88 Supervision believes that the fill rates of the two tracks are normally distributed with equalvariances.Construct a 95% confidence interval estimate of the true mean difference between the twotracks.--------------------------------------------------------------------------------------------------------------2) Two independent simple random samples were selected from two normallydistributed populations with unequal variances yielded the following information:Sample 1…arrow_forward
 MATLAB: An Introduction with ApplicationsStatisticsISBN:9781119256830Author:Amos GilatPublisher:John Wiley & Sons Inc
 Probability and Statistics for Engineering and th...StatisticsISBN:9781305251809Author:Jay L. DevorePublisher:Cengage Learning
 Statistics for The Behavioral Sciences (MindTap C...StatisticsISBN:9781305504912Author:Frederick J Gravetter, Larry B. WallnauPublisher:Cengage Learning
 Elementary Statistics: Picturing the World (7th E...StatisticsISBN:9780134683416Author:Ron Larson, Betsy FarberPublisher:PEARSON
 The Basic Practice of StatisticsStatisticsISBN:9781319042578Author:David S. Moore, William I. Notz, Michael A. FlignerPublisher:W. H. Freeman
 Introduction to the Practice of StatisticsStatisticsISBN:9781319013387Author:David S. Moore, George P. McCabe, Bruce A. CraigPublisher:W. H. Freeman