
Videos
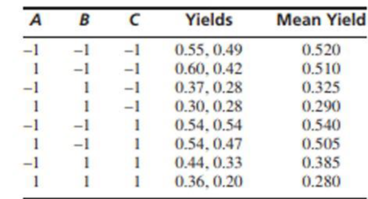
The article “Efficient Pyruvate Production by a Multi-Vitamin Auxotroph of Torulopsis glabrata: Key Role and Optimization of Vitamin Levels” (Y. Li. J. Chen, ct al. Applied Microbiology and Biotechnology, 200l:680–685) investigates the effects of the levels of several vitamins in a cell culture on the yield (in g/L) of pyruvate, a useful organic acid. The data in the following table are presented as two replicates of a 23 design. The factors are A: nicotinic acid. B: thiamine, and C: biotin. (Two statistically insignificant factors have been dropped. In the article, each factor was tested at four levels: we have collapsed these to two.)
- a. Compute estimates of the main effects and interactions, and the sum of squares and P-value for each.
- b. Is the additive model appropriate?
- c. What conclusions about the factors can be drawn from these results?
a.
Obtain the estimates of the main effects and interaction, and sum of squares and P- value for the each treatment combination.
Answer to Problem 4E
The estimates of the main effects and interaction, and sum of squares and P- value for the each treatment combination are given below:
ANOVA table:
| Variable | Effect | DF | Sum of squares | Mean Square | F | P |
| A | –0.04625 | 1 | 0.008556 | 0.008556 | 1.57 | 0.245 |
| B | –0.19875 | 1 | 0.158006 | 0.158006 | 29.03 | 0.001 |
| C | 0.01625 | 1 | 0.001056 | 0.001056 | 0.19 | 0.671 |
| AB | –0.02375 | 1 | 0.002256 | 0.002256 | 0.41 | 0.538 |
| AC | –0.02375 | 1 | 0.002256 | 0.002256 | 0.41 | 0.538 |
| BC | 0.00875 | 1 | 0.000306 | 0.000306 | 0.06 | 0.818 |
| ABC | –0.01125 | 1 | 0.000506 | 0.000506 | 0.09 | 0.768 |
| Error | 8 | 0.043550 | 0.005444 | |||
| Total | 15 |
Explanation of Solution
Given info:
The information is based on conducting the experiment on cell culture on the yield of pyruvate which has two levels for the factors of nicotinic acid (A), thiamine (B), and biotin (C). The experiment of chemical reaction has been conducted twice.
Calculation:
Denote the average yield of the factor A as
Factor A denotes the nicotinic, Factor B denotes the thiamine and Factor C denotes the biotin.
The effect estimate of the treatments is:
The effect estimate of treatment A is:
Substitute the corresponding values of mean yield,
The effect estimate of treatment B is:
The effect estimate of treatment C is:
The effect estimate of treatment AB is:
The effect estimate of treatment AC is:
The effect estimate of treatment BC is:
The effect estimate of treatment ABC is:
The estimates of the main effects and interaction, and sum of squares and P- value for the each treatment combination are given below:
Step-by-step procedure for finding the factorial design table is as follows:
Software procedure:
- Choose Stat > DOE > Factorial > Create Factorial Design.
- Under Type of Design, choose General full factorial design.
- From Number of factors, choose 3.
- Click Designs.
- In Factor A, type A under Name and type 2 Under Number of Levels.
- In Factor B, type B under Name and type 2 Under Number of Levels.
- . In Factor C, type C under Name and type 2 Under Number of Levels.
- From Number of replicates, choose 2.
- Click OK.
- Select Summary table under Results.
- Click OK.
- Enter the corresponding Yield in the newly created factorial design worksheet based on the levels of each factor.
Step-by-step procedure for finding the ANOVA table is as follows:
- Choose Stat > DOE > Factorial > Analyze Factorial Design.
- In Response, enter Yield.
- In Terms, select all the terms.
- In Results, choose “Model summary and ANOVA table”.
- Click OK in all the dialog boxes.
Output obtained by MINITAB procedure is as follows:
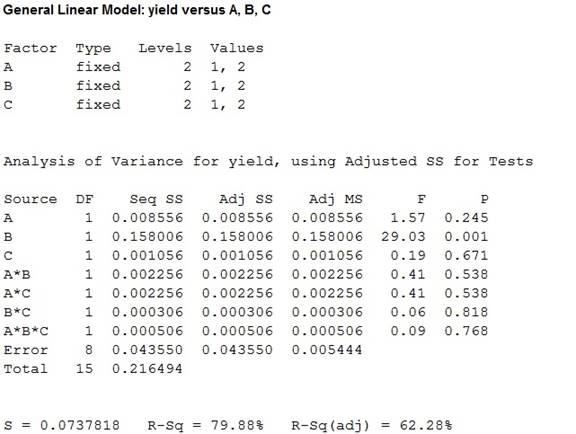
The sum of squares and P- values has been obtained for each treatment combination by using MINITAB.
Thus, the estimates of the main effects and interaction, and sum of squares and P- value for the each treatment combination are given below:
ANOVA table:
| Variable | Effect | DF | Sum of squares | Mean Square | F | P |
| A | –0.04625 | 1 | 0.008556 | 0.008556 | 1.57 | 0.245 |
| B | –0.19875 | 1 | 0.158006 | 0.158006 | 29.03 | 0.001 |
| C | 0.01625 | 1 | 0.001056 | 0.001056 | 0.19 | 0.671 |
| AB | –0.02375 | 1 | 0.002256 | 0.002256 | 0.41 | 0.538 |
| AC | –0.02375 | 1 | 0.002256 | 0.002256 | 0.41 | 0.538 |
| BC | 0.00875 | 1 | 0.000306 | 0.000306 | 0.06 | 0.818 |
| ABC | –0.01125 | 1 | 0.000506 | 0.000506 | 0.09 | 0.768 |
| Error | 8 | 0.043550 | 0.005444 | |||
| Total | 15 |
b.
Check whether the additive model is appropriate.
Answer to Problem 4E
Yes, the additive model is appropriate .
Explanation of Solution
Justification:
Principle rule to hold an additive model:
The additive model is acceptable when the interactions are small.
Hence the additive model is appropriate but interaction effect obtained in previous part (a) does not provide significant results.
c.
State whether any main effects and interaction are important.
Answer to Problem 4E
There is sufficient evidence to conclude that there is no significant difference between the means of two levels in main effect A at
There is sufficient evidence to conclude that there is significant difference between the means of two levels in main effect B at
There is sufficient evidence to conclude that there is no significant difference between the means of two levels in main effect C at
There is sufficient evidence to conclude that the interaction is not significant at
Explanation of Solution
Calculation:
The testing of hypotheses is as follows:
State the hypotheses:
Main factor A:
Null hypothesis:
Alternative hypothesis:
Main factor B:
Null hypothesis:
Alternative hypothesis:
Interaction AB:
Null hypothesis:
Alternative hypothesis:
Interaction AC:
Null hypothesis:
Alternative hypothesis:
Interaction BC:
Null hypothesis:
Alternative hypothesis:
Interaction ABC:
Null hypothesis:
Alternative hypothesis:
Assume that the level of significance as 0.05.
From the MINITAB output obtained in previous part (a), the P- value for main effects and interaction are given below:
| Treatment | P |
| A | 0.245 |
| B | 0.001 |
| C | 0.671 |
| AB | 0.538 |
| AC | 0.538 |
| BC | 0.818 |
| ABC | 0.768 |
Decision:
If
If
Conclusion:
Factor A:
Here, the P-value is greater than the level of significance.
That is,
By rejection rule, fail to reject the null hypothesis.
Thus, there is sufficient evidence to conclude that there is no significant difference between the means of two levels in main effect A at
Factor B:
Here, the P-value is less than the level of significance.
That is,
By rejection rule, reject the null hypothesis.
Thus, there is sufficient evidence to conclude that there is significant difference between the means of two levels in main effect B at
Factor C:
Here, the P-value is greater than the level of significance.
That is,
By rejection rule, fail to reject the null hypothesis.
Thus, there is sufficient evidence to conclude that there is no significant difference between the means of two levels in main effect C at
Interaction AB:
Here, the P-value is greater than the level of significance.
That is,
By rejection rule, fail to reject the null hypothesis.
Thus, there is sufficient evidence to conclude that the interaction AB is not significant at
Interaction AC:
Here, the P-value is greater than the level of significance.
That is,
By rejection rule, fail to reject the null hypothesis.
Thus, there is sufficient evidence to conclude that the interaction AC is not significant at
Interaction BC:
Here, the P-value is greater than the level of significance.
That is,
By rejection rule, fail to reject the null hypothesis.
Thus, there is sufficient evidence to conclude that the interaction BC is not significant at
Interaction ABC:
Here, the P-value is greater than the level of significance.
That is,
By rejection rule, fail to reject the null hypothesis.
Thus, there is sufficient evidence to conclude that the interaction ABC is not significant at
Hence the P-value of Factor B states that it has more effect on the yield than Factor A and Factor C.
Want to see more full solutions like this?
Chapter 9 Solutions
Statistics for Engineers and Scientists
Additional Math Textbook Solutions
Elementary Statistics: Picturing the World (7th Edition)
Elementary Statistics: Picturing the World (6th Edition)
Elementary Statistics
Elementary Statistics: A Step By Step Approach
Elementary Statistics Using The Ti-83/84 Plus Calculator, Books A La Carte Edition (5th Edition)
Applied Statistics in Business and Economics


- An article in the Journal of Applied Polymer Science (Vol. 56, pp. 471–476, 1995) studied the effect of the mole ratio of sebacic acid on the intrinsic viscosity of copolyesters.- The data follows: Viscosity 0.45 0.2 0.34 0.58 0.7 0.57 0.55 0.44 Mole ratio 1 0.9 0.8 0.7 0.6 0.5 0.4 0.3 (a) Construct a scatter diagram of the data.arrow_forwardLow-Birth-Weight Hospital Stays. Data on low-birthweight babies were collected over a 2-year period by 14 participating centers of the National Institute of Child Health and Human Development Neonatal Research Network. Results were reported by J. Lemons et al. in the on-line paper “Very Low Birth Weight Outcomes of the National Institute of ChildHealth and Human Development Neonatal Research Network” (Pediatrics, Vol. 107, No. 1, p. e1). For the 1084 surviving babies whose birth weights were 751– 1000 grams, the average length of stay in the hospital was 86 days, although one center had an average of 66 days and another had an average of 108 days. a. Can the mean lengths of stay be considered population means? Explain your answer.b. Assuming that the population standard deviation is 12 days, determine the z-score for a baby’s length of stay of 86 days at the center where the mean was 66 days.c. Assuming that the population standard deviation is 12 days, determine the z-score for a…arrow_forwardA deficiency of the trace element selenium in the diet can negatively impact growth, immunity, muscle and neuromuscular function, and fertility. The introduction of selenium supplements to dairy cows is justified when pastures have low selenium levels. Authors of the article “Effects of Short-Term Supplementation with Selenised Yeast on Milk Production and Composition of Lactating Cows” (Australian J. of Dairy Tech., 2004: 199–203) supplied the following data on milk selenium concentration (mg/L) for a sample of cows given a selenium supplement and a control sample given no supplement, both initially and after a 9-day period. Obs Init Se Init Cont Final Se Final Cont 1 11.4 9.1 138.3 9.3 2 9.6 8.7 104 8.8 3 10.1 9.7 96.4 8.8 4 8.5 10.8 89 10.1 5 10.3 10.9 88 9.6 6 10.6 10.6 103.8 8.6 7 11.8 10.1 147.3 10.4 8 9.8 12.3 97.1 12.4 9 10.9 8.8 172.6 9.3 10 10.3…arrow_forward
- Consider observed data from a random sample of 390 neurons in an investigation of effect of nutritional level on brain cell growth. Test if brain cell growth is independent of nutrition levels at α= 0.05. Observed Data Poor Adequate Excellent Slow 70 95 35 Normal 90 30 70 a. At the 0.05 level of significance, the data provides sufficient evidence to conclude that cell growth is independent of nutrition. b. At the 0.05 level of significance, the data provides sufficient evidence to conclude that cell growth is equal to the nutrition. c. At the 0.05 level of significance, the data provides sufficient evidence to conclude that cell growth is dependent of nutrition. d. At the 0.05 level of significance, the data provides insufficient evidence to conclude that cell growth is dependent of nutrition.arrow_forwardAn article in Knee Surgery, Sports Traumatology, Arthroscopy, "Arthroscopic meniscal repair with an absorbable screw: results and surgical technique," (2005, Vol. 13, pp. 273-279) cites a success rate of 1% for meniscal tears with a rim width of less than 3 mm, and a 1% success rate for tears from 3-6 mm. If you are unlucky enough to suffer a meniscal tear of less than 3 mm on your left knee, and one of width 3-6 mm on your right knee, what is the probability that you have exactly one successful surgery? assume surgieries are independent.arrow_forwardIn recent years, concerns have been expressed about adverse health effects from amalgam dental restorations, which include mercury. The table below shows results from a study in which some patients were treated with amalgam restorations and others were treated with composite restorations that do not contain mercury (based on data from “Neuropsychological and Renal Effects of Dental Amalgam in Children,” by Bellinger, et al., Journal of the American Medical Association, Vol. 295, No. 15). Use a 0.05 significance level to test for independence between the type of restoration and sensory disorders. Do amalgam restorations appear to affect sensory disorders? Amalgam Composite Sensory disorder 36 28 No sensory disorder 231 239arrow_forward
- An article in Knee Surgery, Sports Traumatology, Arthroscopy (2005, Vol. 13, pp. 273-279) considered arthroscopic meniscal repair with an absorbable screw. Results showed that for tears greater than 25 millimeters, 14 of 18 (78%) repairs were successful, but for shorter tears, 22 of 30 (73%) repairs were successful. A doctor would like to know if there is evidence that the success rate is greater for longer tears. The P-value for the test H0: p1 = p2 versus H1: p1 > p2 is closest to:arrow_forwardThe spike stature of the plants grown from the seeds of the porcine separates (Dactylis glomerata L) collected from the University campus and İbradı Eynif pasture are given below. In this plant, compare whether there is a difference between regions in terms of spike height. Virgo Height (cm) Data obtained from plants collected from university campus 5 6 8 7 8 6 5 5 4 6 6 Data obtained from plants collected from Eynif pasture 12 9 11 9 9 11 9 10 11 10 Note: Your results interpretation according to two different possibilities (Do it separately, assuming that it is 0.07 and 0.04).arrow_forwardObservations on burst strength (lb/in2) were obtainedboth for test nozzle closure welds and for productioncannister nozzle welds (“Proper Procedures Are theKey to Welding Radioactive Waste Cannisters,”Welding J., Aug. 1997: 61–67).Test 7200 6100 7300 7300 8000 74007300 7300 8000 6700 8300Cannister 5250 5625 5900 5900 5700 60505800 6000 5875 6100 5850 6600Construct a comparative boxplot and comment on interestingfeatures (the cited article did not include such a picture, but the authors commented that they had lookedat one).arrow_forward
- Test the hypothesis that the average weekly allowance of female and male ACC 215 students the same, at 5%l evel of significance. Weekly Allowance of Students (Php) Male: 1500 2000 2500 2500 2000 1750 2000 1800 Female:1500 2000 1750 1500 2000 2500 3000 3500 Ho: Ha: α = Decision Rule: Computation: Decision: Conclusion:arrow_forwardSuppose a researcher is interested inthe effectiveness in a new childhood exercise program implemented in a SRS of schools across a particular county. In order to test the hypothesis that the new program decreases BMI (Kg/m2), the researcher takes a SRS of children from schools where the program is employed and a SRS from schools that do not employ the program and compares the results. Assume the following table represents the SRSs of students and their BMIs. Student intervention group BMI (kg/m2) Student control group BMI (kg/m2) A 18.6 A 21.6 B 18.2 B 18.9 C 19.5 C 19.4 D 18.9 D 22.6 E 24.1 F 23.6 A) Assuming that all the necessary conditions are met (normality, independence, etc.) carry out the appropriate statistical test to determine if the new exercise program is effective. Use an alpha level of 0.05. Do not assume equal variances.B) Construct a 95% confidence interval about your estimate for the average difference in BMI between the groups.arrow_forwardDetermine the kurtosis if the data given is a sample.arrow_forward
 MATLAB: An Introduction with ApplicationsStatisticsISBN:9781119256830Author:Amos GilatPublisher:John Wiley & Sons Inc
 Probability and Statistics for Engineering and th...StatisticsISBN:9781305251809Author:Jay L. DevorePublisher:Cengage Learning
 Statistics for The Behavioral Sciences (MindTap C...StatisticsISBN:9781305504912Author:Frederick J Gravetter, Larry B. WallnauPublisher:Cengage Learning
 Elementary Statistics: Picturing the World (7th E...StatisticsISBN:9780134683416Author:Ron Larson, Betsy FarberPublisher:PEARSON
 The Basic Practice of StatisticsStatisticsISBN:9781319042578Author:David S. Moore, William I. Notz, Michael A. FlignerPublisher:W. H. Freeman
 Introduction to the Practice of StatisticsStatisticsISBN:9781319013387Author:David S. Moore, George P. McCabe, Bruce A. CraigPublisher:W. H. Freeman