
a.
Check whether there is any difference in the mean drainage times for the different channel designs or not.
a.
Answer to Problem 11SE
There is sufficient evidence to conclude that there is a significant difference in the mean drainage times with different channel type at
Explanation of Solution
Given info:
The design variable is the channel type and the response is the drainage time. The table provides the drainage time corresponding to the channel type.
Calculation:
State the hypotheses:
Null hypothesis:
Alternative hypothesis:
The ANOVA table can be obtained as follows:
Software procedure:
Step by step procedure to obtain One-Way ANOVA using the MINITAB software:
- Choose Stat > ANOVA > One-Way.
- In Response, enter the column of Drainage time.
- In Factor, enter the column of Channel type.
- In Confidence level, enter 0.95.
- Click OK.
Output using the MINITAB software is given below:
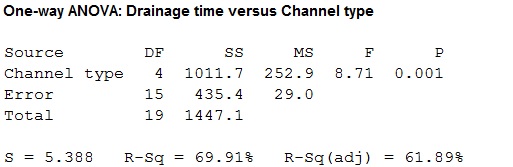
From the ANOVA table, it is clear that P-value is 0.001 and the F-value is 8.71.
Since, the level of significance is not specified; the prior level of significance
Decision:
If
If
Conclusion:
Here, the P-value is less than the level of significance.
That is,
By rejection rule, reject the null hypothesis.
There is sufficient evidence to conclude that there is a significant difference in the mean drainage times with different channel type at
b.
Identify the pairs of designs that can conclude to have differing mean drainage times.
b.
Answer to Problem 11SE
There is sufficient evidence to conclude that the channels 3 and 4 differ from channels 1,2, and 5 at
Explanation of Solution
Calculation:
State the hypotheses:
Null hypothesis:
Alternative hypothesis:
Decision:
By Tukey-Kramer method for multiple comparisons,
If
If
Here
From Appendix A table A.9, the upper 5% point of the
For comparing channel 1 and 2:
The 5% critical value is,
Substitute
The sample means are,
Now,
Which is less than 4.51.
Thus, fail to reject the null hypothesis
Hence, for channel 1 and 2 there is no difference in mean drainage times.
For comparing channel 1 and 3:
The 5% critical value is,
Substitute
The sample means are,
Now,
Which is greater than 4.51.
Thus, reject the null hypothesis
Hence, for channel 1 and 3 there is difference in mean drainage times.
For comparing channel 1 and 4:
The 5% critical value is,
Substitute
The sample means are,
Now,
Which is greater than 4.51.
Thus, reject the null hypothesis
Hence, for channel 1 and 4 there is difference in mean drainage times.
For comparing channel 1 and 5:
The 5% critical value is,
Substitute
The sample means are,
Now,
Which is less than 4.51.
Thus, fail to reject the null hypothesis
Hence, for channel 1 and 5 there is no difference in mean drainage times.
For comparing channel 2 and 3:
The 5% critical value is,
Substitute
Now,
Which is greater than 4.51.
Thus, reject the null hypothesis
Hence, for channel 2 and 3 there is difference in mean drainage times.
For comparing channel 2 and 4:
The 5% critical value is,
Substitute
Now,
Which is greater than 4.51.
Thus, reject the null hypothesis
Hence, for channel 2 and 4 there is difference in mean drainage times.
For comparing channel 2 and 5:
The 5% critical value is,
Substitute
Now,
Which is less than 4.51.
Thus, fail to reject the null hypothesis
Hence, for channel 2 and 5 there is no difference in mean drainage times.
For comparing channel 3 and 4:
The 5% critical value is,
Substitute
Now,
Which is less than 4.51.
Thus, fail to reject the null hypothesis
Hence, for channel 3 and 4 there is no difference in mean drainage times.
For comparing channel 3 and 5:
The 5% critical value is,
Substitute
Now,
Which is greater than 4.51.
Thus, reject the null hypothesis
Hence, for channel 3 and 5 there is difference in mean drainage times.
For comparing channel 4 and 5:
The 5% critical value is,
Substitute
Now,
Which is greater than 4.51.
Thus, reject the null hypothesis
Hence, for channel 4 and 5 there is difference in mean drainage times.
Conclusion:
There is sufficient evidence to conclude that the channels 3 and 4 differ from channels 1,2, and 5 at
Want to see more full solutions like this?
Chapter 9 Solutions
STATISTICS FOR ENGR.+SCI-W/ACCESS

- ) The following table shows 10 communities ranked by decayed, missing, or filled (DMF) teeth per 100 children and fluoride concentration in ppm in the public water supply: Rank by DMF Teeth FluorideCommunity per 100 children X Concentration Y 1 8 1 2 9 3 3 7 4 4 3 9 5 2 8 6 4 77 1…arrow_forwardThe article in the ASCE Journal of Energy Engineering (1999, Vol. 125, pp.59-75) describes a study of the thermal inertia properties of autoclaved aerated concrete used as a building material. Five samples of the material were tested in a structure, and the average interior temperatures (°C) reported were as follows: 23.01, 22.22, 22.04, 22.62, and 22.59. Test that the average interior temperature is equal to 22.5°C using alpha (a) = 0.05. This problem is a test on what population parameter? What is the null and alternative hypothesis? What are the Significance level and type of test? What standardized test statistic will be used? What is the standard test statistic? What is the Statistical Decision? What is the statistical decision in the statement form?arrow_forwardThe annual flows, in cubic meters per second, at the Weldon River at Mill Grove, Missouri for the period 1930 to 1960 are averaged as follows: 3.06 1.52 16.00 2.78 1.15 13.39 2.74 6.16 1.21 5.90 4.06 2.66 11.29 8.46 7.04 12.51 10.91 16.09 3.46 4.28 6.92 11.35 6.95 3.23 18.70 3.75 1.25 2.063.83 18.02 14 .41Fit the lognormal distribution to this data. Comment on the goodness-of-fit to the lognormal distribution.arrow_forward
- The article “Withdrawal Strength of Threaded Nails” (D. Rammer, S. Winistorfer, and D. Bender, Journal of Structural Engineering 2001:442–449) describes an experiment comparing the ultimate withdrawal strengths (in N/mm) for several types of nails. For an annularly threaded nail with shank diameter 3.76 mm driven into spruce-pine-fir lumber, the ultimate withdrawal strength was modeled as lognormal with μ = 3.82 and σ = 0.219. For a helically threaded nail under the same conditions, the strength was modeled as lognormal with μ = 3.47 and σ = 0.272. a) What is the mean withdrawal strength for annularly threaded nails? b) What is the mean withdrawal strength for helically threaded nails? c) For which type of nail is it more probable that the withdrawal strength will be greater than 50 N/mm? d) What is the probability that a helically threaded nail will have a greater withdrawal strength than the median for annularly threaded nails? e) An experiment is performed in which withdrawal…arrow_forwardResearchers interested in lead exposure due to car exhaust sampled the blood of 52 police officers subjected to constant inhalation of automobile exhaust fumes while working traffic enforcement in a primarily urban environment. The blood samples of these officers had an average lead concentration of 124.32 µg/l and a SD of 37.74 µg/l; a previous study of individuals from a nearby suburb, with no history of exposure, found an average blood level concentration of 35 µg/l. Test the hypothesis that the downtown police officers have a higher lead exposure than the group in the previous study. Interpret your results in context. Based on your preceding result, without performing a calculation, would a 99% confidence interval for the average blood concentration level of police officers contain 35 µg/l? Based on your preceding result, without performing a calculation, would a 99% confidence interval for this difference contain 0? Explain why or why not.arrow_forwardConsider the following tank-water system. Tank A holds 200 liters of water, initially pure. Brine with a concentration of 3 grams of salt per liter flows into tank A at 5 liters per minute. The solution flows out of tank A into tank B at a rate of 5 liters per minute. Tank B is a 125 liter tank of initially pure water which receives the outflow from tank A, and the well-mixed solution flows out of tank B at 5 liters per minute. Write down a system of differential equations that models the scenario.arrow_forward
- The Turbine Oil Oxidation Test (TOST) and the Rotating Bomb Oxidation Test (RBOT) are two different procedures for evaluating the oxidation stability of steam turbine oils. An article reported the accompanying observations on x = TOST time (hr) and y = RBOT time (min) for 12 oil specimens. TOST 4200 3600 3750 3650 4050 2770 RBOT 370 345 375 315 350 205 TOST 4870 4525 3450 2700 3750 3325 RBOT 400 380 285 220 345 290 (a) Calculate the value of the sample correlation coefficient. (Round your answer to four decimal places.) r = Carry out a test of hypotheses to decide whether RBOT Time and TOST time are linearly related. (Use ? = 0.05.) Calculate the test statistic and determine the P-value. (Round your test statistic to two decimal places and your P-value to three decimal places.) t = P-value =arrow_forwardThe aging Neotropical termites (Neocapritermes taracua) secrete a sticky, blue-colored liquid that they spew to intruding termites. The younger Neotropical termites secrete a liquid that lacks the blue component, so it is white in appearance. In an experiment that measured the toxicity of the blue substance, the researchers placed one drop of either the blue liquid or the white liquid on individuals of a second termite species, Labiotermes labralis. Of the 41 Labiotermes labralis that got the blue drop, 37 were immobilized. Of the 40 Labiotermes labralis that got the white drop, 9 were immobilized. Is the blue liquid toxic compared to the white liquid?arrow_forwardSolve An article in the ASCE Journal of Energy Engineering (1999, Vol. 125, pp.59-75) describes a study of the thermal inertia properties of autoclaved aerated concrete used as a building material. Five samples of the material were tested in a structure, and the average interior temperatures (°C) reported were as follows: 23.01, 22.22, 22.04, 22.62, and 22.59. Test that the average interior temperature is equal to 22.5°C using alpha (a) = 0.05. 1.)This problem is a test on what population parameter? a.Variance/ Standard Deviation b.Mean c.Population Proportion d.None of the above 2.)What is the null and alternative 3 points hypothesis? a.Ho / (theta = 22.5) , Ha: (0 # 22.5) b.Ho / (theta > 22.5) , Ha: (0 # 22.5) c.Ho / (theta < 22.5) , Ha: (theta >= 22.5) d.None of the above 3.)What are the Significance level 3 points and type of test? alpha = 0.05 two-tailed alpha = 0.95 two-tailed alpha = 0.95 one-tailed None of the above 4.)What standardized test statistic will…arrow_forward
- Data for nine girders in the form of the ratio of predicted to observed load for two procedures, the Karlsruhe and Lehigh methods, are as follows: Girder Karlsruhe Lehigh 1 1.186 1.061 2 1.151 0.992 3 1.322 1.063 4 1.339 1.062 5 1.200 1.065 6 1.402 1.178 7 1.365 1.037 8 1.537 1.086 9 1.559 1.052 1) calculate the t-value and what is your conclusion at (α = 0.05)? 2) What is the 90% confidence interval for the difference in means?arrow_forwardListed below are amounts of strontium-90 (in millibecquerels, or mBq) in a simple random sample of baby teeth obtained from residents in a region born after 1979. Use the given data to construct a boxplot and identify the 5-number summary. 129 132 135 140 141 145 148 151 154 157 159 159 161 164 165 170 173 173 175 182 The 5-number summary is nothing, nothing, nothing, nothing, and nothing, all in mBq. (Use ascending order. Type integers or decimals. Do not round.)arrow_forwardFor b there are two cases and for c I have to plug the initial data into the odearrow_forward
 MATLAB: An Introduction with ApplicationsStatisticsISBN:9781119256830Author:Amos GilatPublisher:John Wiley & Sons Inc
 Probability and Statistics for Engineering and th...StatisticsISBN:9781305251809Author:Jay L. DevorePublisher:Cengage Learning
 Statistics for The Behavioral Sciences (MindTap C...StatisticsISBN:9781305504912Author:Frederick J Gravetter, Larry B. WallnauPublisher:Cengage Learning
 Elementary Statistics: Picturing the World (7th E...StatisticsISBN:9780134683416Author:Ron Larson, Betsy FarberPublisher:PEARSON
 The Basic Practice of StatisticsStatisticsISBN:9781319042578Author:David S. Moore, William I. Notz, Michael A. FlignerPublisher:W. H. Freeman
 Introduction to the Practice of StatisticsStatisticsISBN:9781319013387Author:David S. Moore, George P. McCabe, Bruce A. CraigPublisher:W. H. Freeman