
Videos
The antibiotic gentamicin sulphate is often blended with acrylic bone cement to help prevent infection following joint replacement surgery. The article “Incorporation of Large Amounts of Gentamicin Sulphate Into Acrylic Bone Cement: Effect on Handling and Mechanical Properties, Antibiotic Release, and Biofilm Formation” (N. Dunne, P. McAfee, ct al., Journal of Engineering in Medicine. 2008:355–365) presents a study of the effect of the amount of antibiotic added on various properties of the cement. Following are measurements of the setting time of the cement, for six levels of antibiotic amount, and three replications per level. The measurements are consistent with means and standard deviations presented in the article.
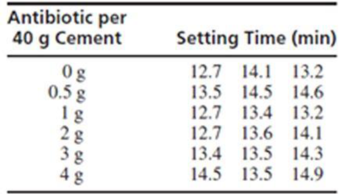
- a. Construct an ANOVA table. You may give a
range for the P-value. - b. Can you conclude that there are differences among the
mean setting times?
Want to see the full answer?
Check out a sample textbook solution
Chapter 9 Solutions
STATISTICS FOR ENGR.+SCI-W/ACCESS
Additional Math Textbook Solutions
Business Statistics: A First Course (8th Edition)
Research Methods for the Behavioral Sciences (MindTap Course List)
Statistical Techniques in Business and Economics
Business Statistics: A First Course (7th Edition)


- classify as either observational or experimental design Heart Failure. In the paper “Cardiac-Resynchronization Therapy with or without an Implantable Defibrillator in Advanced Chronic Heart Failure” (New England Journal of Medicine, Vol. 350, pp. 2140–2150), M. Bristow et al. reported the results of a study of methods for treating patients who had advanced heart failure due to ischemic or nonischemic cardiomyopathies. A total of 1520 patientswere randomly assigned in a 1:2:2 ratio to receive optimal pharmacologic therapy alone or in combination with either a pacemaker or a pacemaker–defibrillator combination. The patients were thenobserved until they died or were hospitalized for any cause.arrow_forwardA research on the effect of duodenal infusion of donor feces for recurrent Clostridium difficile examined patients with C. difficile infections which cause persistent diarrhea. Some patients were given the antibiotic vancomycin, while others were given a fecal transplant. At alpha = 0.01, test if the result is dependent on the type of treatment given.arrow_forwardStressed-Out Bus Drivers. Previous studies have shown that urban bus drivers have an extremely stressful job, and a large proportion of drivers retire prematurely with disabilities due to occupational stress. In the paper, “Hassles on the Job: A Study of a Job Intervention With Urban Bus Drivers” (Journal of Organizational Behavior, Vol. 20, pp. 199–208), G. Evans et al. examined the effects of an intervention program to improve the conditions of urban bus drivers.Amongother variables, the researchers monitored diastolic blood pressure of bus drivers in downtown Stockholm, Sweden. The data, in millimeters of mercury (mm Hg), on the WeissStats site are based on the blood pressures obtained prior to intervention for the 41 bus drivers in the study. Use the technology of your choice to do the following. a. Obtain a normal probability plot, boxplot, histogram, and stemand-leaf diagram of the data. b. Based on your results from part (a), can you reasonably apply the one-mean t-test to the…arrow_forward
- In a study conducted in the Science Department of Faculty of Science, Technology and Human Development in a University; the researcher examined the influence of the drug succinylcholine on the circulation levels of androgens in the blood. Blood samples from wild, free-ranging deer were obtained via the jugular vein immediately after an intramuscular injection of succinylcholine using darts and a capture gun. Deer were bled again approximately 30 minutes after the injection and then released. The level of androgens at time of capture and 30 minutes later, measured in nanograms per milliliter (ng/ml), for 15 deers as in Table Q1. Assuming that the populations of androgen at time of injection and 30 minutes later are normally distributed:i) Find the average and standard deviation of this studyii)Determine the critical region of this problem.iii) Test at the 0.05 level of significance whether the androgen concentrations are altered after 30 minutes of restraint.arrow_forwardSuppose a researcher is interested inthe effectiveness in a new childhood exercise program implemented in a SRS of schools across a particular county. In order to test the hypothesis that the new program decreases BMI (Kg/m2), the researcher takes a SRS of children from schools where the program is employed and a SRS from schools that do not employ the program and compares the results. Assume the following table represents the SRSs of students and their BMIs. Student intervention group BMI (kg/m2) Student control group BMI (kg/m2) A 18.6 A 21.6 B 18.2 B 18.9 C 19.5 C 19.4 D 18.9 D 22.6 E 24.1 F 23.6 A) Assuming that all the necessary conditions are met (normality, independence, etc.) carry out the appropriate statistical test to determine if the new exercise program is effective. Use an alpha level of 0.05. Do not assume equal variances.B) Construct a 95% confidence interval about your estimate for the average difference in BMI between the groups.arrow_forwardThe authors of the article “Predictive Model for PittingCorrosion in Buried Oil and Gas Pipelines”(Corrosion, 2009: 332–342) provided the data on whichtheir investigation was based.a. Consider the following sample of 61 observations onmaximum pitting depth (mm) of pipeline specimensburied in clay loam soil. 0.41 0.41 0.41 0.41 0.43 0.43 0.43 0.48 0.480.58 0.79 0.79 0.81 0.81 0.81 0.91 0.94 0.941.02 1.04 1.04 1.17 1.17 1.17 1.17 1.17 1.171.17 1.19 1.19 1.27 1.40 1.40 1.59 1.59 1.601.68 1.91 1.96 1.96 1.96 2.10 2.21 2.31 2.462.49 2.57 2.74 3.10 3.18 3.30 3.58 3.58 4.154.75 5.33 7.65 7.70 8.13 10.41 13.44Construct a stem-and-leaf display in which the twolargest values are shown in a last row labeled HI.b. Refer back to (a), and create a histogram based oneight classes with 0 as the lower limit of the firstclass and class widths of .5, .5, .5, .5, 1, 2, 5, and 5,respectively.c. The accompanying comparative boxplot fromMinitab shows plots of pitting depth for four differenttypes of soils.…arrow_forward
- Dexamethasone and IQ. In the paper “Outcomes at School Age After Postnatal Dexamethasone Therapy for Lung Disease of Prematurity” (New England Journal of Medicine, Vol. 350, No. 13, pp. 1304–1313), T. Yeh et al. studied the outcomes at school age in children who had participated in a double-blind, placebo-controlled trial of early postnatal dexamethasone therapy for the prevention of chronic lung disease of prematurity. All of the infants in the study had had severe respiratory distress syndrome requiring mechanical ventilation shortly after birth. On the WeissStats site, we provide the school-age IQs of the 74 children in the control group, based on the study results. Use the technology of your choice to do the following. a. Obtain a normal probability plot, boxplot, histogram, and stemand-leaf diagram of the data. b. Based on your results from part (a), can you reasonably apply one-standard-deviation χ2-procedures to the data? Explain your reasoning. c. Overall, IQs of school-age…arrow_forwardThe article “Drift in Posturography Systems Equipped with a Piezoelectric Force Platform: Analysis and Numerical Compensation” (L. Quagliarella, N. Sasanelli, and V. Monaco, IEEE Transactions on Instrumentation and Measurement, 2008: 997–1004) reported the results of an experiment to determine the effect of load on the drift in signals derived from a piezoelectric force plate. The correlation coefficient y between output and time under a load of 588 N was −0.9515. Measurements were taken 100 times per second for 300 seconds, for a total of 30,000 measurements. Find a 95% confidence interval for the population correlation ρ.arrow_forwardAn article in the Journal of the Electrochemical Society (Vol. 139, No. 2, 1992, pp. 524–532) describes anexperiment to investigate the low-pressure vapor deposition of polysilicon. The experiment was carried outin a large-capacity reactor at Sematech in Austin, Texas. The reactor has several wafer positions, and fourof these positions are selected at random. The response variable is film thickness uniformity. Threereplicates of the experiment were run, and the data are as follows:a. Test the significance of these wafer position with α=0.05.b. If proven significant, perform a multiple comparison method using Fisher’s LSD.arrow_forward
- In its January 25, 2012, issue, the Journal of the American Medical Association reported on the effects of overconsumption of low, normal, and high protein diets on weight gain, energy expenditure, and body composition. Researchers conducted a single blind, randomized controlled trial of 25 U.S. adults. The subjects were healthy, weight-stable, male and female volunteers, aged 18 to 35 years. All subjects consumed a weight-stabilizing diet for 13 to 25 days. Afterwards, the researchers randomly assigned participants to diets containing various percentages of energy from protein: 5% (low protein), 15% (normal protein), or 25% (high protein). The subjects were not aware of the specific protein level diet to which they were assigned. On these diets the researchers overfed the participants during the last 8 weeks of their 10 to 12 week stay in the inpatient metabolic unit. The goal was to investigate the effect of overconsumption of protein on weight gain, energy expenditure, and body…arrow_forwardThe article “Bioremediation of Soil Contaminated Crude Oil by Agaricomycetes” (Mohammad-Sichani, Assadi, et al., Journal of Environmental Health and Engineering, 2017, online) describes an experiment to determine the effectiveness of mushroom compost in removing petroleum contaminants from soil. Out of 150 seeds planted in soil containing 3% mushroom compost by weight, 74 germinated. Out of 150 seeds planted in soil containing 5% mushroom compost by weight, 86 germinated. Find a 95% confidence interval for the difference between the proportions of seeds that germinate.arrow_forwardLactation promotes a temporary loss of bone mass to provide adequate amounts of calcium for milk production. The paper “Bone Mass Is Recovered from Lactation to Postweaning in Adolescent Mothers with Low Calcium Intakes” (Amer. J. of Clinical Nutr., 2004: 1322–1326) gave the following data on total body bone mineral content (TBBMC) (g) for a sample both during lactation (L) and in the postweaning period (P). SubjectL 1928 2549 2825 1924 1628 2175 2114 2621 1843 2541P 2126 2885 2895 1942 1750 2184 2164 2626 2006 2627 Does the data suggest that true average total body bone mineral content during postweaning exceeds that during lactation by more than 25 g? State and test the appropriate hypotheses using a significance level of .05.arrow_forward
 MATLAB: An Introduction with ApplicationsStatisticsISBN:9781119256830Author:Amos GilatPublisher:John Wiley & Sons Inc
 Probability and Statistics for Engineering and th...StatisticsISBN:9781305251809Author:Jay L. DevorePublisher:Cengage Learning
 Statistics for The Behavioral Sciences (MindTap C...StatisticsISBN:9781305504912Author:Frederick J Gravetter, Larry B. WallnauPublisher:Cengage Learning
 Elementary Statistics: Picturing the World (7th E...StatisticsISBN:9780134683416Author:Ron Larson, Betsy FarberPublisher:PEARSON
 The Basic Practice of StatisticsStatisticsISBN:9781319042578Author:David S. Moore, William I. Notz, Michael A. FlignerPublisher:W. H. Freeman
 Introduction to the Practice of StatisticsStatisticsISBN:9781319013387Author:David S. Moore, George P. McCabe, Bruce A. CraigPublisher:W. H. Freeman