Elementary Statistics Books a la carte Plus NEW MyLab Statistics with Pearson eText - Access Card Package (6th Edition)
6th Edition
ISBN: 9780133876239
Author: Ron Larson, Betsy Farber
Publisher: PEARSON
bartleby

Concept explainers

bartleby

Videos

Textbook Question
Book Icon
Chapter 9.1, Problem 23E

Constructing a Scatter Plot and Determining Correlation In Exercises 23–28, (a) display the data in a scatter plot, (b) calculate the sample correlation coefficient r, (c) describe the type of correlation, if any, and interpret the correlation in the context of the data, and (d) use Table 11 in Appendix B to make a conclusion about the correlation coefficient. If convenient, use technology. Let a = 0.01.

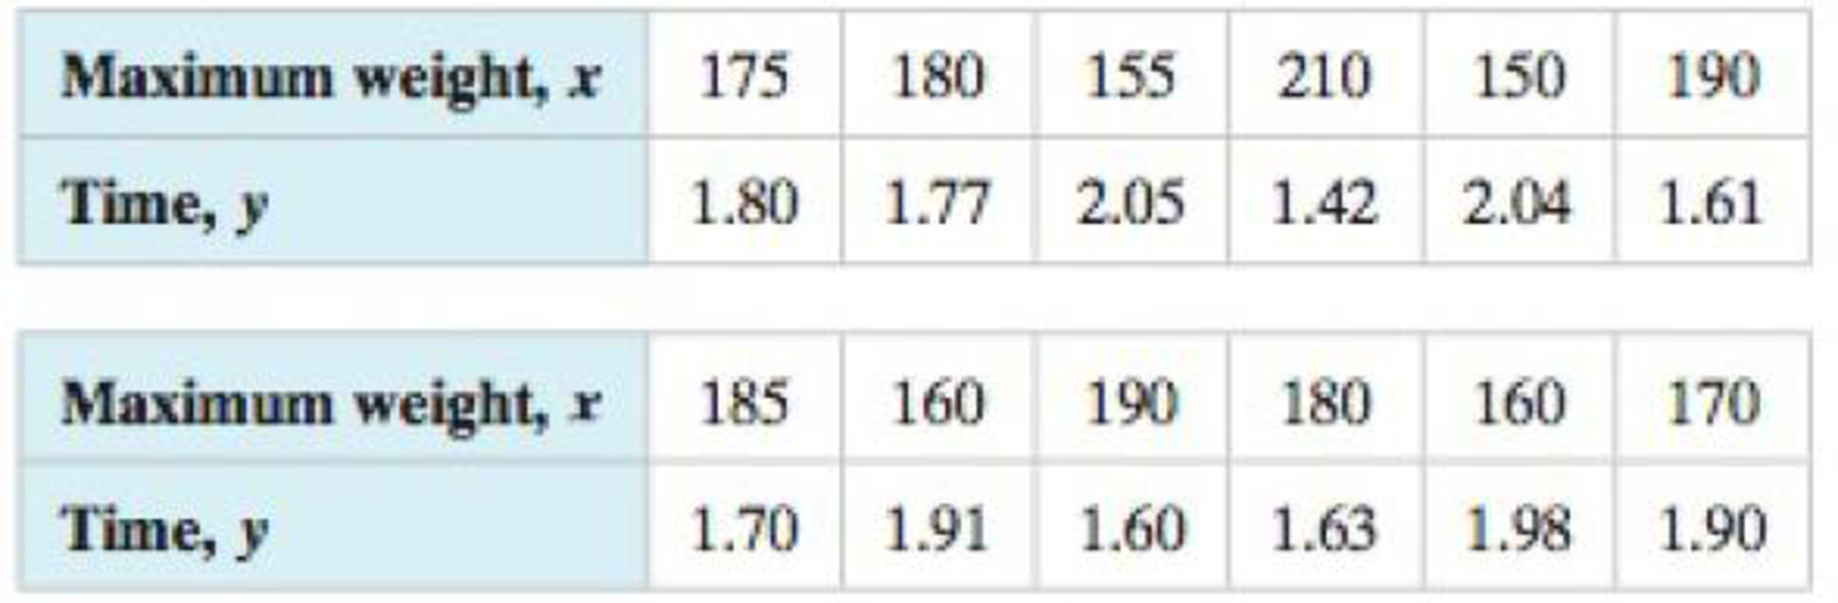
26. Maximal Strength and Sprint Performance The maximum weights (in kilograms) for which one repetition of a half squat can be performed and the times (in seconds) to run a 10-meter sprint for 12 international soccer players (Adapted from British Journal of Sports Medicine)

Chapter 9.1, Problem 23E, Constructing a Scatter Plot and Determining Correlation In Exercises 2328, (a) display the data in a

Blurred answer
Students have asked these similar questions
Testing for Rank Correlation. In Exercises 7–12, use the rank correlation coefficient to test for a correlation between the two variables. Use a significance level of α = 0.05 CPI and the Subway Use CPI/subway data from the preceding exercise to test for a correlation between the CPI (Consumer Price Index) and the subway fare.
Testing for Rank Correlation. In Exercises 7–12, use the rank correlation coefficient to test for a correlation between the two variables. Use a significance level of α = 0.05 Chocolate and Nobel Prizes The table below lists chocolate consumption (kg per capita) and the numbers of Nobel Laureates (per 10 million people) for several different countries (from Data Set 16 in Appendix B). Is there a correlation between chocolate consumption and the rate of Nobel Laureates? How could such a correlation be explained?

Chapter 9 Solutions

Elementary Statistics Books a la carte Plus NEW MyLab Statistics with Pearson eText - Access Card Package (6th Edition)

Ch. 9.1 - What does the sample correlation coefficient r...Ch. 9.1 - Give examples of two variables that have perfect...Ch. 9.1 - Explain how to determine whether a sample...Ch. 9.1 - Discuss the difference between r and p.Ch. 9.1 - Prob. 8ECh. 9.1 - Graphical Analysis In Exercises 912, determine...Ch. 9.1 - Graphical Analysis In Exercises 912, determine...Ch. 9.1 - Prob. 11ECh. 9.1 - Graphical Analysis In Exercises 912, determine...Ch. 9.1 - Prob. 13ECh. 9.1 - Graphical Analysis In Exercises 912, determine...Ch. 9.1 - Graphical Analysis In Exercises 1518, the scatter...Ch. 9.1 - Graphical Analysis In Exercises 1518, the scatter...Ch. 9.1 - Graphical Analysis In Exercises 1518, the scatter...Ch. 9.1 - Graphical Analysis In Exercises 1518, the scatter...Ch. 9.1 - In Exercises 13 and 14, identify the explanatory...Ch. 9.1 - In Exercises 13 and 14, identify the explanatory...Ch. 9.1 - Prob. 21ECh. 9.1 - Prob. 22ECh. 9.1 - Constructing a Scatter Plot and Determining...Ch. 9.1 - Constructing a Scatter Plot and Determining...Ch. 9.1 - Prob. 25ECh. 9.1 - Constructing a Scatter Plot and Determining...Ch. 9.1 - Prob. 27ECh. 9.1 - Prob. 28ECh. 9.1 - Prob. 29ECh. 9.1 - Prob. 30ECh. 9.1 - The t-Test for Correlation Coefficients In...Ch. 9.1 - The t-Test for Correlation Coefficients In...Ch. 9.1 - Prob. 34ECh. 9.1 - Prob. 33ECh. 9.1 - Interchanging x and y In Exercise 26, let the time...Ch. 9.1 - Generate a new data set. Using your knowledge of...Ch. 9.1 - Describe how to create a data set with a value of...Ch. 9.1 - Describe how to create a data set with a value of...Ch. 9.1 - Try to create a data set with a value of r that is...Ch. 9.2 - Prob. 1TYCh. 9.2 - Prob. 2TYCh. 9.2 - Prob. 3TYCh. 9.2 - What is a residual? Explain when a residual is...Ch. 9.2 - Two variables have a positive linear correlation....Ch. 9.2 - Explain how to predict y-values using the equation...Ch. 9.2 - For a set of data and a corresponding regression...Ch. 9.2 - In order to predict y-values using the equation of...Ch. 9.2 - Why is it not appropriate to use a regression line...Ch. 9.2 - In Exercises 712, match the description in the...Ch. 9.2 - In Exercises 712, match the description in the...Ch. 9.2 - In Exercises 712, match the description in the...Ch. 9.2 - In Exercises 712, match the description in the...Ch. 9.2 - In Exercises 712, match the description in the...Ch. 9.2 - In Exercises 712, match the description in the...Ch. 9.2 - Prob. 13ECh. 9.2 - Prob. 14ECh. 9.2 - Prob. 15ECh. 9.2 - Prob. 16ECh. 9.2 - Prob. 17ECh. 9.2 - Prob. 18ECh. 9.2 - Finding the Equation of a Regression Line In...Ch. 9.2 - Prob. 20ECh. 9.2 - Finding the Equation of a Regression Line In...Ch. 9.2 - Finding the Equation of a Regression Line In...Ch. 9.2 - Prob. 23ECh. 9.2 - Prob. 24ECh. 9.2 - Finding the Equation of a Regression Line In...Ch. 9.2 - Finding the Equation of a Regression Line In...Ch. 9.2 - Prob. 27ECh. 9.2 - Prob. 28ECh. 9.2 - Prob. 29ECh. 9.2 - Prob. 30ECh. 9.2 - Interchanging X and y In Exercises 31 and 32,...Ch. 9.2 - Interchanging X and y In Exercises 31 and 32,...Ch. 9.2 - In Exercises 33 and 34, (a) find the equation of...Ch. 9.2 - In Exercises 33 and 34, (a) find the equation of...Ch. 9.2 - In Exercises 35 and 36, (a) construct a scatter...Ch. 9.2 - Prob. 36ECh. 9.2 - Prob. 37ECh. 9.2 - Prob. 38ECh. 9.2 - Prob. 39ECh. 9.2 - Prob. 40ECh. 9.2 - Prob. 41ECh. 9.2 - Prob. 42ECh. 9.2 - Prob. 43ECh. 9.2 - Prob. 44ECh. 9.2 - Prob. 45ECh. 9.2 - Prob. 46ECh. 9.2 - Prob. 47ECh. 9.2 - Prob. 48ECh. 9.2 - Prob. 1ACh. 9.2 - Prob. 2ACh. 9.2 - Prob. 3ACh. 9.2 - Prob. 4ACh. 9.2 - Prob. 1CSCh. 9.2 - Prob. 2CSCh. 9.2 - Prob. 3CSCh. 9.2 - Prob. 4CSCh. 9.2 - Prob. 5CSCh. 9.3 - Prob. 1TYCh. 9.3 - Prob. 2TYCh. 9.3 - Prob. 3TYCh. 9.3 - Graphical Analysis In Exercises 13, use the...Ch. 9.3 - Graphical Analysis In Exercises 13, use the...Ch. 9.3 - Graphical Analysis In Exercises 13, use the...Ch. 9.3 - The coefficient of determination r2 is the ratio...Ch. 9.3 - What is the coefficient of determination for two...Ch. 9.3 - Two variables have a bivariate normal...Ch. 9.3 - In Exercises 710, use the value of the correlation...Ch. 9.3 - In Exercises 710, use the value of the correlation...Ch. 9.3 - In Exercises 710, use the value of the correlation...Ch. 9.3 - In Exercises 710, use the value of the correlation...Ch. 9.3 - Finding the Coefficient of Determination and the...Ch. 9.3 - Prob. 12ECh. 9.3 - Prob. 13ECh. 9.3 - Finding the Coefficient of Determination and the...Ch. 9.3 - Prob. 15ECh. 9.3 - Prob. 16ECh. 9.3 - Prob. 17ECh. 9.3 - Prob. 18ECh. 9.3 - Prob. 19ECh. 9.3 - Prob. 20ECh. 9.3 - Constructing and Interpreting a Prediction...Ch. 9.3 - Prob. 22ECh. 9.3 - Prob. 23ECh. 9.3 - Constructing and Interpreting a Prediction...Ch. 9.3 - Prob. 25ECh. 9.3 - Prob. 26ECh. 9.3 - Prob. 27ECh. 9.3 - Prob. 28ECh. 9.3 - Prob. 29ECh. 9.3 - Prob. 30ECh. 9.3 - Prob. 31ECh. 9.3 - Prob. 32ECh. 9.3 - Prob. 33ECh. 9.3 - Prob. 34ECh. 9.3 - Prob. 35ECh. 9.3 - Prob. 36ECh. 9.3 - Prob. 37ECh. 9.3 - In Exercises 37 and 38, construct the indicated...Ch. 9.4 - Prob. 1TYCh. 9.4 - Prob. 2TYCh. 9.4 - Predicting y-Values In Exercises 14, use the...Ch. 9.4 - Predicting y-Values In Exercises 14, use the...Ch. 9.4 - Prob. 3ECh. 9.4 - Predicting y-Values In Exercises 14, use the...Ch. 9.4 - Prob. 5ECh. 9.4 - Prob. 6ECh. 9.4 - Prob. 7ECh. 9.4 - Prob. 8ECh. 9 - Prob. 2UACh. 9 - Prob. 9.1.1RECh. 9 - Prob. 9.1.2RECh. 9 - In Exercises 14, (a) display the data in a scatter...Ch. 9 - In Exercises 14, (a) display the data in a scatter...Ch. 9 - Prob. 9.1.5RECh. 9 - Prob. 9.1.6RECh. 9 - Prob. 9.1.7RECh. 9 - Prob. 9.1.8RECh. 9 - Prob. 9.2.9RECh. 9 - Prob. 9.2.10RECh. 9 - In Exercises 912, find the equation of the...Ch. 9 - Prob. 9.2.12RECh. 9 - In Exercises 1316, use the value of the...Ch. 9 - Prob. 9.3.14RECh. 9 - Prob. 9.3.15RECh. 9 - Prob. 9.3.16RECh. 9 - Prob. 9.3.17RECh. 9 - Prob. 9.3.18RECh. 9 - Prob. 9.3.19RECh. 9 - Prob. 9.3.20RECh. 9 - Prob. 9.3.21RECh. 9 - In Exercises 1924, construct the indicated...Ch. 9 - Prob. 9.3.23RECh. 9 - Prob. 9.3.24RECh. 9 - Prob. 9.4.25RECh. 9 - Prob. 9.4.26RECh. 9 - Prob. 9.4.27RECh. 9 - Prob. 9.4.28RECh. 9 - Prob. 1CQCh. 9 - Prob. 2CQCh. 9 - Prob. 3CQCh. 9 - Prob. 4CQCh. 9 - Prob. 5CQCh. 9 - Prob. 6CQCh. 9 - Prob. 7CQCh. 9 - Prob. 8CQCh. 9 - Prob. 9CQCh. 9 - Prob. 1CTCh. 9 - Prob. 2CTCh. 9 - Prob. 3CTCh. 9 - Prob. 4CTCh. 9 - Prob. 5CTCh. 9 - Prob. 6CTCh. 9 - Prob. 7CTCh. 9 - Prob. 8CTCh. 9 - Net Sales The equation used to predict the net...Ch. 9 - Prob. 1RSRDCh. 9 - Prob. 2RSRDCh. 9 - Prob. 1TCh. 9 - Prob. 2TCh. 9 - Prob. 3TCh. 9 - Prob. 4TCh. 9 - Prob. 5TCh. 9 - Use technology to find the multiple regression...Ch. 9 - Prob. 7T
Knowledge Booster
Background pattern image
Statistics
Learn more about
Need a deep-dive on the concept behind this application? Look no further. Learn more about this topic, statistics and related others by exploring similar questions and additional content below.
Recommended textbooks for you
Text book image
Big Ideas Math A Bridge To Success Algebra 1: Stu...
Algebra
ISBN:9781680331141
Author:HOUGHTON MIFFLIN HARCOURT
Publisher:Houghton Mifflin Harcourt
Text book image
Glencoe Algebra 1, Student Edition, 9780079039897...
Algebra
ISBN:9780079039897
Author:Carter
Publisher:McGraw Hill
Text book image
Algebra and Trigonometry (MindTap Course List)
Algebra
ISBN:9781305071742
Author:James Stewart, Lothar Redlin, Saleem Watson
Publisher:Cengage Learning
Correlation Vs Regression: Difference Between them with definition & Comparison Chart; Author: Key Differences;https://www.youtube.com/watch?v=Ou2QGSJVd0U;License: Standard YouTube License, CC-BY
Correlation and Regression: Concepts with Illustrative examples; Author: LEARN & APPLY : Lean and Six Sigma;https://www.youtube.com/watch?v=xTpHD5WLuoA;License: Standard YouTube License, CC-BY