
Elementary Statistics Books a la carte Plus NEW MyLab Statistics with Pearson eText - Access Card Package (6th Edition)
6th Edition
ISBN: 9780133876239
Author: Ron Larson, Betsy Farber
Publisher: PEARSON
expand_more
expand_more
format_list_bulleted
Concept explainers
Videos
Textbook Question
Chapter 9.3, Problem 3E
Graphical Analysis In Exercises 1–3, use the figure.
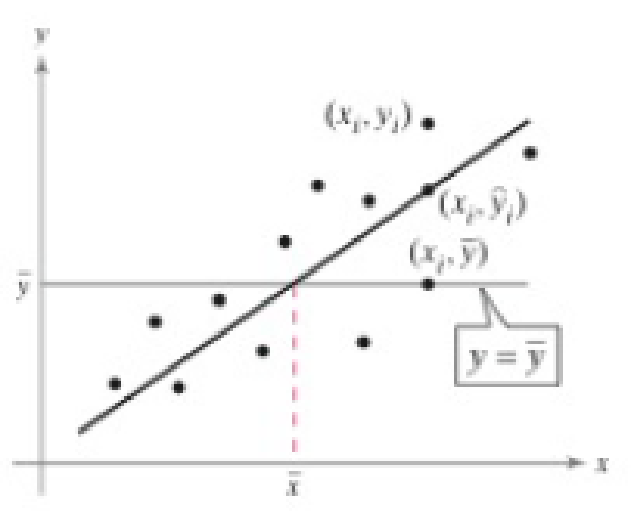
3. Describe the unexplained variation about a regression line in words and in symbols.
Expert Solution & Answer
Want to see the full answer?
Check out a sample textbook solution
Chapter 9 Solutions
Elementary Statistics Books a la carte Plus NEW MyLab Statistics with Pearson eText - Access Card Package (6th Edition)
Ch. 9.1 - Prob. 1TYCh. 9.1 - Prob. 2TYCh. 9.1 - Prob. 3TYCh. 9.1 - Prob. 4TYCh. 9.1 - Prob. 5TYCh. 9.1 - Prob. 6TYCh. 9.1 - Prob. 7TYCh. 9.1 - Prob. 1ECh. 9.1 - Prob. 2ECh. 9.1 - Describe the range of values for the correlation...
Ch. 9.1 - What does the sample correlation coefficient r...Ch. 9.1 - Give examples of two variables that have perfect...Ch. 9.1 - Explain how to determine whether a sample...Ch. 9.1 - Discuss the difference between r and p.Ch. 9.1 - Prob. 8ECh. 9.1 - Graphical Analysis In Exercises 912, determine...Ch. 9.1 - Graphical Analysis In Exercises 912, determine...Ch. 9.1 - Prob. 11ECh. 9.1 - Graphical Analysis In Exercises 912, determine...Ch. 9.1 - Prob. 13ECh. 9.1 - Graphical Analysis In Exercises 912, determine...Ch. 9.1 - Graphical Analysis In Exercises 1518, the scatter...Ch. 9.1 - Graphical Analysis In Exercises 1518, the scatter...Ch. 9.1 - Graphical Analysis In Exercises 1518, the scatter...Ch. 9.1 - Graphical Analysis In Exercises 1518, the scatter...Ch. 9.1 - In Exercises 13 and 14, identify the explanatory...Ch. 9.1 - In Exercises 13 and 14, identify the explanatory...Ch. 9.1 - Prob. 21ECh. 9.1 - Prob. 22ECh. 9.1 - Constructing a Scatter Plot and Determining...Ch. 9.1 - Constructing a Scatter Plot and Determining...Ch. 9.1 - Prob. 25ECh. 9.1 - Constructing a Scatter Plot and Determining...Ch. 9.1 - Prob. 27ECh. 9.1 - Prob. 28ECh. 9.1 - Prob. 29ECh. 9.1 - Prob. 30ECh. 9.1 - The t-Test for Correlation Coefficients In...Ch. 9.1 - The t-Test for Correlation Coefficients In...Ch. 9.1 - Prob. 34ECh. 9.1 - Prob. 33ECh. 9.1 - Interchanging x and y In Exercise 26, let the time...Ch. 9.1 - Generate a new data set. Using your knowledge of...Ch. 9.1 - Describe how to create a data set with a value of...Ch. 9.1 - Describe how to create a data set with a value of...Ch. 9.1 - Try to create a data set with a value of r that is...Ch. 9.2 - Prob. 1TYCh. 9.2 - Prob. 2TYCh. 9.2 - Prob. 3TYCh. 9.2 - What is a residual? Explain when a residual is...Ch. 9.2 - Two variables have a positive linear correlation....Ch. 9.2 - Explain how to predict y-values using the equation...Ch. 9.2 - For a set of data and a corresponding regression...Ch. 9.2 - In order to predict y-values using the equation of...Ch. 9.2 - Why is it not appropriate to use a regression line...Ch. 9.2 - In Exercises 712, match the description in the...Ch. 9.2 - In Exercises 712, match the description in the...Ch. 9.2 - In Exercises 712, match the description in the...Ch. 9.2 - In Exercises 712, match the description in the...Ch. 9.2 - In Exercises 712, match the description in the...Ch. 9.2 - In Exercises 712, match the description in the...Ch. 9.2 - Prob. 13ECh. 9.2 - Prob. 14ECh. 9.2 - Prob. 15ECh. 9.2 - Prob. 16ECh. 9.2 - Prob. 17ECh. 9.2 - Prob. 18ECh. 9.2 - Finding the Equation of a Regression Line In...Ch. 9.2 - Prob. 20ECh. 9.2 - Finding the Equation of a Regression Line In...Ch. 9.2 - Finding the Equation of a Regression Line In...Ch. 9.2 - Prob. 23ECh. 9.2 - Prob. 24ECh. 9.2 - Finding the Equation of a Regression Line In...Ch. 9.2 - Finding the Equation of a Regression Line In...Ch. 9.2 - Prob. 27ECh. 9.2 - Prob. 28ECh. 9.2 - Prob. 29ECh. 9.2 - Prob. 30ECh. 9.2 - Interchanging X and y In Exercises 31 and 32,...Ch. 9.2 - Interchanging X and y In Exercises 31 and 32,...Ch. 9.2 - In Exercises 33 and 34, (a) find the equation of...Ch. 9.2 - In Exercises 33 and 34, (a) find the equation of...Ch. 9.2 - In Exercises 35 and 36, (a) construct a scatter...Ch. 9.2 - Prob. 36ECh. 9.2 - Prob. 37ECh. 9.2 - Prob. 38ECh. 9.2 - Prob. 39ECh. 9.2 - Prob. 40ECh. 9.2 - Prob. 41ECh. 9.2 - Prob. 42ECh. 9.2 - Prob. 43ECh. 9.2 - Prob. 44ECh. 9.2 - Prob. 45ECh. 9.2 - Prob. 46ECh. 9.2 - Prob. 47ECh. 9.2 - Prob. 48ECh. 9.2 - Prob. 1ACh. 9.2 - Prob. 2ACh. 9.2 - Prob. 3ACh. 9.2 - Prob. 4ACh. 9.2 - Prob. 1CSCh. 9.2 - Prob. 2CSCh. 9.2 - Prob. 3CSCh. 9.2 - Prob. 4CSCh. 9.2 - Prob. 5CSCh. 9.3 - Prob. 1TYCh. 9.3 - Prob. 2TYCh. 9.3 - Prob. 3TYCh. 9.3 - Graphical Analysis In Exercises 13, use the...Ch. 9.3 - Graphical Analysis In Exercises 13, use the...Ch. 9.3 - Graphical Analysis In Exercises 13, use the...Ch. 9.3 - The coefficient of determination r2 is the ratio...Ch. 9.3 - What is the coefficient of determination for two...Ch. 9.3 - Two variables have a bivariate normal...Ch. 9.3 - In Exercises 710, use the value of the correlation...Ch. 9.3 - In Exercises 710, use the value of the correlation...Ch. 9.3 - In Exercises 710, use the value of the correlation...Ch. 9.3 - In Exercises 710, use the value of the correlation...Ch. 9.3 - Finding the Coefficient of Determination and the...Ch. 9.3 - Prob. 12ECh. 9.3 - Prob. 13ECh. 9.3 - Finding the Coefficient of Determination and the...Ch. 9.3 - Prob. 15ECh. 9.3 - Prob. 16ECh. 9.3 - Prob. 17ECh. 9.3 - Prob. 18ECh. 9.3 - Prob. 19ECh. 9.3 - Prob. 20ECh. 9.3 - Constructing and Interpreting a Prediction...Ch. 9.3 - Prob. 22ECh. 9.3 - Prob. 23ECh. 9.3 - Constructing and Interpreting a Prediction...Ch. 9.3 - Prob. 25ECh. 9.3 - Prob. 26ECh. 9.3 - Prob. 27ECh. 9.3 - Prob. 28ECh. 9.3 - Prob. 29ECh. 9.3 - Prob. 30ECh. 9.3 - Prob. 31ECh. 9.3 - Prob. 32ECh. 9.3 - Prob. 33ECh. 9.3 - Prob. 34ECh. 9.3 - Prob. 35ECh. 9.3 - Prob. 36ECh. 9.3 - Prob. 37ECh. 9.3 - In Exercises 37 and 38, construct the indicated...Ch. 9.4 - Prob. 1TYCh. 9.4 - Prob. 2TYCh. 9.4 - Predicting y-Values In Exercises 14, use the...Ch. 9.4 - Predicting y-Values In Exercises 14, use the...Ch. 9.4 - Prob. 3ECh. 9.4 - Predicting y-Values In Exercises 14, use the...Ch. 9.4 - Prob. 5ECh. 9.4 - Prob. 6ECh. 9.4 - Prob. 7ECh. 9.4 - Prob. 8ECh. 9 - Prob. 2UACh. 9 - Prob. 9.1.1RECh. 9 - Prob. 9.1.2RECh. 9 - In Exercises 14, (a) display the data in a scatter...Ch. 9 - In Exercises 14, (a) display the data in a scatter...Ch. 9 - Prob. 9.1.5RECh. 9 - Prob. 9.1.6RECh. 9 - Prob. 9.1.7RECh. 9 - Prob. 9.1.8RECh. 9 - Prob. 9.2.9RECh. 9 - Prob. 9.2.10RECh. 9 - In Exercises 912, find the equation of the...Ch. 9 - Prob. 9.2.12RECh. 9 - In Exercises 1316, use the value of the...Ch. 9 - Prob. 9.3.14RECh. 9 - Prob. 9.3.15RECh. 9 - Prob. 9.3.16RECh. 9 - Prob. 9.3.17RECh. 9 - Prob. 9.3.18RECh. 9 - Prob. 9.3.19RECh. 9 - Prob. 9.3.20RECh. 9 - Prob. 9.3.21RECh. 9 - In Exercises 1924, construct the indicated...Ch. 9 - Prob. 9.3.23RECh. 9 - Prob. 9.3.24RECh. 9 - Prob. 9.4.25RECh. 9 - Prob. 9.4.26RECh. 9 - Prob. 9.4.27RECh. 9 - Prob. 9.4.28RECh. 9 - Prob. 1CQCh. 9 - Prob. 2CQCh. 9 - Prob. 3CQCh. 9 - Prob. 4CQCh. 9 - Prob. 5CQCh. 9 - Prob. 6CQCh. 9 - Prob. 7CQCh. 9 - Prob. 8CQCh. 9 - Prob. 9CQCh. 9 - Prob. 1CTCh. 9 - Prob. 2CTCh. 9 - Prob. 3CTCh. 9 - Prob. 4CTCh. 9 - Prob. 5CTCh. 9 - Prob. 6CTCh. 9 - Prob. 7CTCh. 9 - Prob. 8CTCh. 9 - Net Sales The equation used to predict the net...Ch. 9 - Prob. 1RSRDCh. 9 - Prob. 2RSRDCh. 9 - Prob. 1TCh. 9 - Prob. 2TCh. 9 - Prob. 3TCh. 9 - Prob. 4TCh. 9 - Prob. 5TCh. 9 - Use technology to find the multiple regression...Ch. 9 - Prob. 7T
Knowledge Booster


Learn more about
Need a deep-dive on the concept behind this application? Look no further. Learn more about this topic, statistics and related others by exploring similar questions and additional content below.Similar questions
- Life Expectancy The following table shows the average life expectancy, in years, of a child born in the given year42 Life expectancy 2005 77.6 2007 78.1 2009 78.5 2011 78.7 2013 78.8 a. Find the equation of the regression line, and explain the meaning of its slope. b. Plot the data points and the regression line. c. Explain in practical terms the meaning of the slope of the regression line. d. Based on the trend of the regression line, what do you predict as the life expectancy of a child born in 2019? e. Based on the trend of the regression line, what do you predict as the life expectancy of a child born in 1580?2300arrow_forwardDoes the following table represent a linear function ? If so, find the linear equation that models the data.arrow_forwardA regression was run to determine whether there is arelationship between the diameter of a tree (x, in inches) and the tree’s age (y, in years). Theresults of the regression are given below. Use this topredict the age of a tree with diameter 10 inches. y=ax+ba=6.301b=1.044r=0.970arrow_forward
- TEST YOUR UNDERSTANDING The following table shows the average price P, in dollars, of a gallon of regular gas t years after 2000. t = year since 2000 0 2 4 7 8 P = price in dollars 1.51 1.36 1.88 2.80 3.27 Find the equation of the regression line for P as a function of t. What price does your model give for gas in 2009? Compute your answer with the actual value of 2.35.arrow_forwardHOW DO YOU SEE IT? Discuss how well a linear model approximates the data shown in each scatter plot.arrow_forwardWhat is regression analysis? Describe the process of performing regression analysis on a graphing utility.arrow_forward
arrow_back_ios
arrow_forward_ios
Recommended textbooks for you
 Glencoe Algebra 1, Student Edition, 9780079039897...AlgebraISBN:9780079039897Author:CarterPublisher:McGraw Hill
 Functions and Change: A Modeling Approach to Coll...AlgebraISBN:9781337111348Author:Bruce Crauder, Benny Evans, Alan NoellPublisher:Cengage Learning
 Big Ideas Math A Bridge To Success Algebra 1: Stu...AlgebraISBN:9781680331141Author:HOUGHTON MIFFLIN HARCOURTPublisher:Houghton Mifflin Harcourt
 Algebra & Trigonometry with Analytic GeometryAlgebraISBN:9781133382119Author:SwokowskiPublisher:Cengage
Glencoe Algebra 1, Student Edition, 9780079039897...
Algebra
ISBN:9780079039897
Author:Carter
Publisher:McGraw Hill
Functions and Change: A Modeling Approach to Coll...
Algebra
ISBN:9781337111348
Author:Bruce Crauder, Benny Evans, Alan Noell
Publisher:Cengage Learning
Big Ideas Math A Bridge To Success Algebra 1: Stu...
Algebra
ISBN:9781680331141
Author:HOUGHTON MIFFLIN HARCOURT
Publisher:Houghton Mifflin Harcourt
Algebra & Trigonometry with Analytic Geometry
Algebra
ISBN:9781133382119
Author:Swokowski
Publisher:Cengage
Correlation Vs Regression: Difference Between them with definition & Comparison Chart; Author: Key Differences;https://www.youtube.com/watch?v=Ou2QGSJVd0U;License: Standard YouTube License, CC-BY
Correlation and Regression: Concepts with Illustrative examples; Author: LEARN & APPLY : Lean and Six Sigma;https://www.youtube.com/watch?v=xTpHD5WLuoA;License: Standard YouTube License, CC-BY