
INTRODUCTION TO STATISTICS & DATA ANALYS
6th Edition
ISBN: 9780357420447
Author: PECK
Publisher: CENGAGE L
expand_more
expand_more
format_list_bulleted
Concept explainers
Videos
Textbook Question
Chapter 9.1, Problem 9E
A random sample of 10 houses heated with natural gas in a particular area is selected, and the amount of gas (in therms) used during the month of January is determined for each house. The resulting observations are as follows:
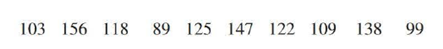
- Let μJ denote the average gas usage during January by all houses in this area. Calculate a point estimate of μJ.
- Suppose that 10,000 houses in this area use natural gas for heating. Let τ denote the total amount of gas used by all of these houses during January. Estimate τ using the given data. What statistic did you use to calculate your estimate?
- Use the given data to estimate p, the proportion of all houses that used at least 100 therms.
- Give a point estimate of the population median usage based on the given data. Which statistic did you use?
Expert Solution & Answer

Trending nowThis is a popular solution!

Students have asked these similar questions
Use the standard error to construct a approximate prediction interval for Y using an alpha of 5%. (Round your answer to 2 decimal places
x
x
Fuel Economy of Selected Vehicles (n = 73, k = 4)
Obs
Vehicle
CityMPG
Length
Width
Weight
ManTran
1
Acura TL
20
109.3
74.0
3968
0
2
Audi A5
22
108.3
73.0
3583
1
3
BMW 4 Series 428i
22
182.6
71.9
3470
0
4
BMW X1 sDrive28i
23
176.5
70.8
3527
0
5
Buice LaCrosse
18
196.9
73.1
3990
0
6
Buick Enclave
17
201.9
79.0
4724
0
7
Buick Regal
21
190.2
73.1
3692
0
8
Cadillac ATS
22
182.8
71.1
3315
0
9
Cadillac CTS
20
195.5
72.2
3616
0
10
Cadillac Escalade
14
202.5
79.0
5527
0
11
Chevrolet Camaro 1SS
16
190.6
75.5
3719
1
12
Chevrolet Cruze LS
26
181.0
70.7
3097
0
13
Chevrolet Impala LTZ
19
201.3
73.0
3800
0
14
Chevrolet Malibu 2LT
25
191.5
73.0
3532
0
15
Chevrolet Spark LS
31
144.7
61.0
2269
1
16
Chevrolet Suburban LTZ
15
224.0
80.5
5674
0
17
Chrysler 200 Touring LX
20
191.7
72.5…
A sample of 12 radon detectors of a certain type was selected, and each was exposed to
100 pCi/L of radon. The resulting readings were as follows:
105.6
90.9
91.2
96.9
96.5
91.3
100.1
105.5
99.6
107.7
103.3
92.4
Does this data suggest that the population mean reading under these conditions differ
from 100?
(a)
State the null and alternative hypotheses.
(b)
Calculate, correct to 2 decimal places,
(i)
the sample mean, x ; and
(ii)
the sample standard deviation, s.
(c)
Evaluate the appropriate test statistic.
(d)
Test these hypotheses at 0.05 level of significance.
A researcher estimates that the average height of the buildings of 30 or more stories in a large city is at most 700 feet. A random sample of 10 buildings is selected, and the heights in feet are shown. At α = 0.025, is there enough evidence to reject the claim? 485 511 841 725 615 520 535 635 616 582 What is the critical value of the t?
Chapter 9 Solutions
INTRODUCTION TO STATISTICS & DATA ANALYS
Ch. 9.1 - Three different statistics are being considered...Ch. 9.1 - a. Why is an unbiased statistic generally...Ch. 9.1 - The report The 2016 Consumer Financial Literacy...Ch. 9.1 - The authors of the paper Influence of Biofeedback...Ch. 9.1 - Each person in a random sample of 20 students at a...Ch. 9.1 - Suppose that each of 935 smokers received a...Ch. 9.1 - Given below are the sodium contents (in mg) for...Ch. 9.1 - A random sample of n = 12 four-year-old red pine...Ch. 9.1 - A random sample of 10 houses heated with natural...Ch. 9.2 - Explain which would result in a wider large-sample...
Ch. 9.2 - Explain which would result in a wider large-sample...Ch. 9.2 - The formula used to calculate a large-sample...Ch. 9.2 - The use of the interval p(zcriticalvalue)p(1p)n...Ch. 9.2 - For each of the following combinations of sample...Ch. 9.2 - Discuss how each of the following factors affects...Ch. 9.2 - The USA TODAY Snapshot titled Social Media...Ch. 9.2 - Based on data from a survey of 1200 randomly...Ch. 9.2 - The report Parents, Teens and Digital Monitoring...Ch. 9.2 - If a hurricane was headed your way, would you...Ch. 9.2 - The USA TODAY Snapshot titled Big Bang Theory (USA...Ch. 9.2 - The article Most Dog Owners Take More Pictures of...Ch. 9.2 - The Princeton Review 2016 College Hopes and...Ch. 9.2 - The USA TODAY Snapshot titled Babys First Photo...Ch. 9.2 - The report Job Seeker Nation Study...Ch. 9.2 - USA TODAY reported that the proportion of...Ch. 9.2 - The USA TODAY Snapshot titled Have a Nice Trip...Ch. 9.2 - Business Insider reported that a study...Ch. 9.2 - In 2010, the National Football League adopted new...Ch. 9.2 - The article Most Americans Dont Understand the...Ch. 9.2 - The Gallup Organization conducts an annual survey...Ch. 9.2 - The article Hospitals Dispute Medtronic Data on...Ch. 9.2 - Based on survey of a representative sample of 1000...Ch. 9.2 - A discussion of digital ethics appears in the...Ch. 9.2 - In spite of the potential safety hazards, some...Ch. 9.2 - In 2010, the online security firm Symantec...Ch. 9.3 - Given a variable that has at distribution with the...Ch. 9.3 - The formula used to calculate a confidence...Ch. 9.3 - USA TODAY reported that the average amount of...Ch. 9.3 - Samples of two different models of cars were...Ch. 9.3 - USA TODAY reported that the average amount of...Ch. 9.3 - The paper The Effects of Adolescent Volunteer...Ch. 9.3 - Medical research has shown that repeated wrist...Ch. 9.3 - Students in a representative sample of 65...Ch. 9.3 - The paper referenced in the previous exercise also...Ch. 9.3 - Suppose that a random sample of 50 bottles of a...Ch. 9.3 - The authors of the paper Driving Performance While...Ch. 9.3 - The article The Association Between Television...Ch. 9.3 - The paper Patterns and Composition of Weight...Ch. 9.3 - Because of safety considerations, in May 2003 the...Ch. 9.3 - Example 9.3 gave the following airborne times (in...Ch. 9.3 - Consumer Reports gave the following mileage...Ch. 9.3 - Five students visiting the student health center...Ch. 9.3 - The Bureau of Alcohol, Tobacco, and Firearms...Ch. 9.3 - The formula described in this section for...Ch. 9.4 - The following quote is from the article Credit...Ch. 9.4 - Authors of the news release titled Major Gaps...Ch. 9.4 - The paper The Curious Promiscuity of Queen Honey...Ch. 9.5 - A survey on SodaHead...Ch. 9.5 - Prob. 59ECh. 9.5 - Prob. 60ECh. 9.5 - Prob. 61ECh. 9.5 - Prob. 62ECh. 9.5 - Prob. 63ECh. 9.5 - Prob. 64ECh. 9.5 - Prob. 65ECh. 9.6 - Prob. 66ECh. 9.6 - Prob. 67ECh. 9.6 - Teams in the National Football League (NFL) are...Ch. 9.6 - Prob. 69ECh. 9.6 - The Economist collects data each year on the price...Ch. 9.6 - Major League Baseball (MLB) includes two groups of...Ch. 9 - The article Write It by Hand to Make It Stick...Ch. 9 - Prob. 73CRCh. 9 - The report The 2016 Consumer Financial Literacy...Ch. 9 - The report The Politics of Climate (Pew Research...Ch. 9 - The report referenced in the previous exercise...Ch. 9 - Data from a survey of a representative sample was...Ch. 9 - A manufacturer of small appliances purchases...Ch. 9 - A manufacturer of college textbooks is interested...Ch. 9 - The confidence intervals presented in this chapter...Ch. 9 - Prob. 81CRCh. 9 - The interval from 2.33 to 1.75 captures an area of...
Knowledge Booster


Learn more about
Need a deep-dive on the concept behind this application? Look no further. Learn more about this topic, statistics and related others by exploring similar questions and additional content below.Similar questions
- A sample of 12 radon detectors of a certain type was selected, and each was exposed to 100 pCi/L of radon. The resulting readings were as follows: 104.3 89.6 89.9 95.6 95.2 90.0 98.8 103.7 98.3 106.4 102.0 91.1 a)Does this data suggest that the population mean reading under these conditions differs from 100? State and test the appropriate hypotheses using =.05. b) Suppose that prior to the experiment, a value of teta=7.5 had been assumed. How many determinations would then have been appropriate to obtain beta=.10 for the alternative u=95 ?arrow_forwardAssume that the readings at freezing on a batch of thermometers are normally distributed with a mean of 0°C and a standard deviation of 1.00°C.A single thermometer is randomly selected and tested. Let ZZ represent the reading of this thermometer at freezing. What reading separates the highest 15.39% from the rest? That is, if P(z>c)=0.1539P(z>c)=0.1539, find c.arrow_forwardThe probability mass function of X = the number of major defects in an electrical appliance of a randomly selected type is: Calculate the following:a) E (X)b) V (X) directly from the definitionarrow_forward
- In a random sample of size 150, there were 90 individuals in the category of interest. Answer the following questions. (a) Find the point estimate. (b) If ?1H1: ?>0.5p>0.5 at ?=0.01α=0.01, find the critical value.arrow_forwardA continuous random variable X has a pdf of the form: f(x) = (824/9) x^2, for 0.01 < X < 0.32. Calculate the standard deviation (sigma) of X.arrow_forwardConsider a random sample X1, … , Xn from the pdff (x; u) = .5(1 + (THETA)x) -1 <= x <= 1where -1 <= theta <= 1 (this distribution arises in particlephysics). Show that theta = 3X is an unbiased estimator oftheta. [Hint: First determine mu = E(X) = E(X).]arrow_forward
- A product is designed to have length of 14cm+/0.12cm. the output of the manufacturing process is identified to be centered at 14.0.042cm and the standard deviation is estimated at 0.014cm. determine the capability of the system Cparrow_forwardThe data in the accompanying table are from a paper. Suppose that each person in a random sample of 49 male students and in a random sample of 88 female students at a particular college was classified according to gender and whether they usually or rarely eat three meals a day. Find the test statistic and P-value. (Use SALT. Round your test statistic to three decimal places and your P-value to four decimal places.) Usually Eat3 Meals a Day Rarely Eat3 Meals a Day Male 26 23 Female 35 53arrow_forwardAssume that females have pulse rates that are normally distributed with a mean of u= 73.0 and a standard deviation of o= 12.5. Complete parts a through c below. A) If 1 adult female is randomly selected, find the probability that her pulse rate is between 67 beats per minute and 79 beats per minute.arrow_forward
- Assume the time required to fully recharge an electric car is uniformly distributed between 160 and 220 minutes. What is the expected charge time, E(x)?arrow_forwardLet X1, . . . , Xn i.i.d. U([θ1, θ2]), i.e., X1, . . . , Xn are independent and follow a uniform distribution on the interval [θ1, θ2] for θ1, θ2 ∈ R and θ1 < θ2. Find an estimator for θ1 and θ2 using the method of moments.arrow_forward1. Consider the Gaussian distribution N (m, σ2).(a) Show that the pdf integrates to 1.(b) Show that the mean is m and the variance is σ.arrow_forward
arrow_back_ios
SEE MORE QUESTIONS
arrow_forward_ios
Recommended textbooks for you
 MATLAB: An Introduction with ApplicationsStatisticsISBN:9781119256830Author:Amos GilatPublisher:John Wiley & Sons Inc
 Probability and Statistics for Engineering and th...StatisticsISBN:9781305251809Author:Jay L. DevorePublisher:Cengage Learning
 Statistics for The Behavioral Sciences (MindTap C...StatisticsISBN:9781305504912Author:Frederick J Gravetter, Larry B. WallnauPublisher:Cengage Learning
 Elementary Statistics: Picturing the World (7th E...StatisticsISBN:9780134683416Author:Ron Larson, Betsy FarberPublisher:PEARSON
 The Basic Practice of StatisticsStatisticsISBN:9781319042578Author:David S. Moore, William I. Notz, Michael A. FlignerPublisher:W. H. Freeman
 Introduction to the Practice of StatisticsStatisticsISBN:9781319013387Author:David S. Moore, George P. McCabe, Bruce A. CraigPublisher:W. H. Freeman
MATLAB: An Introduction with Applications
Statistics
ISBN:9781119256830
Author:Amos Gilat
Publisher:John Wiley & Sons Inc
Probability and Statistics for Engineering and th...
Statistics
ISBN:9781305251809
Author:Jay L. Devore
Publisher:Cengage Learning
Statistics for The Behavioral Sciences (MindTap C...
Statistics
ISBN:9781305504912
Author:Frederick J Gravetter, Larry B. Wallnau
Publisher:Cengage Learning
Elementary Statistics: Picturing the World (7th E...
Statistics
ISBN:9780134683416
Author:Ron Larson, Betsy Farber
Publisher:PEARSON
The Basic Practice of Statistics
Statistics
ISBN:9781319042578
Author:David S. Moore, William I. Notz, Michael A. Fligner
Publisher:W. H. Freeman
Introduction to the Practice of Statistics
Statistics
ISBN:9781319013387
Author:David S. Moore, George P. McCabe, Bruce A. Craig
Publisher:W. H. Freeman
Statistics 4.1 Point Estimators; Author: Dr. Jack L. Jackson II;https://www.youtube.com/watch?v=2MrI0J8XCEE;License: Standard YouTube License, CC-BY
Statistics 101: Point Estimators; Author: Brandon Foltz;https://www.youtube.com/watch?v=4v41z3HwLaM;License: Standard YouTube License, CC-BY
Central limit theorem; Author: 365 Data Science;https://www.youtube.com/watch?v=b5xQmk9veZ4;License: Standard YouTube License, CC-BY
Point Estimate Definition & Example; Author: Prof. Essa;https://www.youtube.com/watch?v=OTVwtvQmSn0;License: Standard Youtube License
Point Estimation; Author: Vamsidhar Ambatipudi;https://www.youtube.com/watch?v=flqhlM2bZWc;License: Standard Youtube License