
Videos
(a)
Construct a
(a)
Answer to Problem 9P
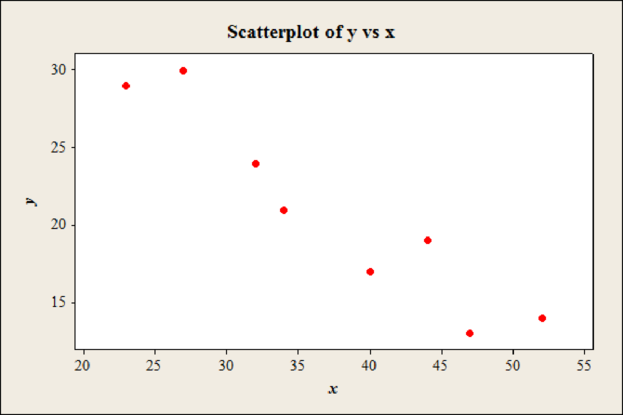
The scatter diagram for data is,
Explanation of Solution
Calculation:
The variable x denotes the weight of the car (in hundreds of pounds) and y denotes the miles per gallon (mpg).
Step by step procedure to obtain scatter plot using MINITAB software is given below:
- Choose Graph > Scatterplot.
- Choose Simple. Click OK.
- In Y variables, enter the column of x.
- In X variables, enter the column of y.
- Click OK.
(b)
Verify the values of
(b)
Explanation of Solution
Calculation:
The formula for
In the formula, n is the sample size.
The values are verified in the table below,
| x | y | xy | ||
| 27 | 30 | 729 | 900 | 810 |
| 44 | 19 | 1936 | 361 | 836 |
| 32 | 24 | 1024 | 576 | 768 |
| 47 | 13 | 2209 | 169 | 611 |
| 23 | 29 | 529 | 841 | 667 |
| 40 | 17 | 1600 | 289 | 680 |
| 34 | 21 | 1156 | 441 | 714 |
| 52 | 14 | 2704 | 196 | 728 |
Hence, the values are verified.
The number of data pairs are
Hence, the value of r is verified as approximately –0.946.
(c)
Find the value of
Find the value of
Find the value of a.
Find the value of b.
Find the equation of the least-squares line.
(c)
Answer to Problem 9P
The value of
The value of
The value of a is 43.326.
The value of b is –0.6007.
The equation of the least-squares line is
Explanation of Solution
Calculation:
From part (b), the values are
The value of
Hence, the value of
The value of
Hence, the value of
The value of b is,
Hence, the value of b is –0.6007.
The value of a is,
Hence, the value of a is 43.326.
The equation of the least-squares line is,
Hence, the equation of the least-squares line is
(d)
Construct a scatter diagram with least squares line.
Locate the point
(d)
Answer to Problem 9P
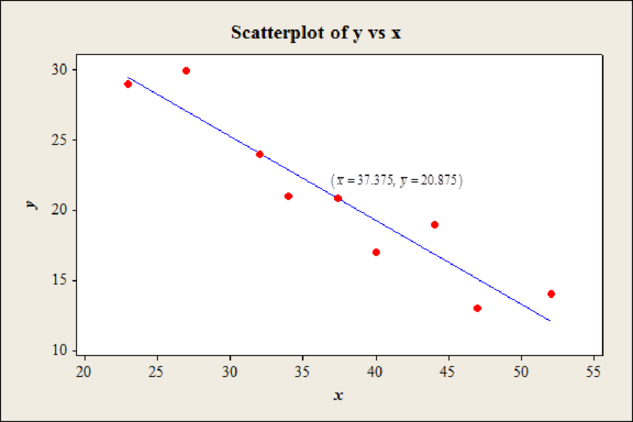
The scatter diagram with least squares line with point
Explanation of Solution
Calculation:
In the dataset of eight weights and miles per gallon also include the point
Step by step procedure to obtain scatter plot using MINITAB software is given below:
- Choose Graph > Scatterplot.
- Choose With regression. Click OK.
- In Y variables, enter the column of x.
- In X variables, enter the column of y.
- Click OK.
(e)
Find the value of the coefficient of determination
Mention percentage of the variation in y that can be explained by variation in x.
Mention percentage of the variation in y that cannot be explained by variation in x.
(e)
Answer to Problem 9P
The value of the coefficient of determination
The percentage of the variation in y that can be explained by variation in x is 89.4%.
The percentage of the variation in y that cannot be explained by variation in x is 10.6%.
Explanation of Solution
Calculation:
Coefficient of determination
The coefficient of determination
From part (b), the value of correlation coefficient r is –0.946. The value of
Hence, the value of the coefficient of determination
About 89.4% of the variation in y (miles per gallon (mpg)) is explained by x (weight of the car (in hundreds of pounds)). Since the value of
Hence, the percentage of the variation in y that can be explained by variation in x is 89.4%.
About 10.6%
Hence, the percentage of the variation in y that cannot be explained by variation in x is 10.6%.
(f)
Find the number of miles per gallon for car weight
(f)
Answer to Problem 9P
The number of miles per gallon for car weight
Explanation of Solution
Calculation:
From part (c), the equation of the least-squares line is
Substitute
Hence, the number of miles per gallon for car weight
Want to see more full solutions like this?
Chapter 9 Solutions
Understandable Statistics: Concepts and Methods


- How did you get the variance for this problem ?arrow_forwardA statistician wants to determine if there is a difference in the fuel efficiency of cars between model years. To do this, he selects random makes and models of cars and compares the fuel efficiency in miles per gallon of the current model year and the previous model year. Suppose that data were collected for a random sample of 9 cars, where each difference is calculated by subtracting the fuel efficiency in miles per gallon of the previous model year from the fuel efficiency in miles per gallon of the current model year. Assume that the fuel efficiencies are normally distributed. What type of test is this hypothesis test? A. This is a two-tailed test because the alternative hypothesis is Ha:μd≠0. B. This is a right-tailed test because the alternative hypothesis is Ha:μd>0. C. This is a right-tailed test because the alternative hypothesis is Ha:μd<0. D. This is a left-tailed test because the alternative hypothesis is Ha:μd<0. E. This is a left-tailed…arrow_forwardIf the coefficient of correlation between two variables is -0.6, their coefficient of determination will be?arrow_forward
- A random sample of 20 newly-born baby boys showed an average weight of 7.40 pounds while a sample of 25 newly-born baby girls showed a mean weight of 6.50 pounds. If the variance of all newly-born babies are 1.25 pounds, can we say that newly-born baby boys are heavier than newly-born baby girls using the 0.05 level?arrow_forwardIf all 24 samples from a population produce the same age x = 20, what are the sample meanµ and the sample variance 82? What if x = 20 or 21, 12 times each?arrow_forwardHow do I calculate the correlation coefficient from the information provided in the attached image?arrow_forward
- A nutritionist believes that obesity is more prevalent among American adults than it was in the past. He discovers that in a study conducted in the year 1994, 380 of the 1630 randomly chosen adults were classified as obese. However, in a more recent study, he finds 726 out of 2350 randomly chosen adults were classified as obese. At α = 0.05, do these studies provide evidence to support the nutritionist's claim that the proportion of obese adults has significantly increased since 1994?arrow_forwardOnce the correlation coefficient is known, how can we find the amount of the shared variance?arrow_forwardA statistician for an automotive review magazine wants to determine whether there is a difference in the fuel efficiency of passenger vehicles between model years 2013 and 2018. To do this, he selects random makes and models of passenger vehicles and compares the fuel efficiency in miles per gallon of the 2018 model year and the 2013 model year. Suppose that data were collected for a random sample of 9 passenger vehicles, where each difference is calculated by subtracting the fuel efficiency in miles per gallon of the 2013 model year from the fuel efficiency in miles per gallon of the 2018 model year. Assume that the fuel efficiencies are normally distributed. The test statistic is t≈6.163, α=0.10, the corresponding rejection regions are t<−1.860 and t>1.860, the null hypothesis is H0:μd=0, and the alternative hypothesis is Ha:μd≠0. Which of the following statements are accurate for this hypothesis test in order to evaluate the claim that the true mean difference between the fuel…arrow_forward
- In the past decade, two presidential elections in the United States have witnessed very long wait times at precincts (voting stations) in states that ultimately decided the election (Florida in 2000 and Ohio in 2004). In Philadelphia as well, some voters complained about the long lines in some precincts, with most complaints coming from precinct A. In 2004, the average number of voters arriving at Precinct A was 35 per hour and the arrivals of voters was random with inter-arrival times that had a coefficient of variation of 1 (CVa=1). Philadelphia deployed 1 voting machine in Precinct A. Suppose that each voter spent on average 100 seconds in the voting booth (this is the time needed to cast her/his vote using a voting machine), with a standard deviation of 120 seconds. Given the long wait times for Precinct A, the city of Philadelphia is thinking of alternative solutions to improve voting conditions. One of the proposed solutions is as follows. Proposal 1: Deploy an additional voting…arrow_forwardIn the past decade, two presidential elections in the United States have witnessed very long wait times at precincts (voting stations) in states that ultimately decided the election (Florida in 2000 and Ohio in 2004).In Philadelphia as well, some voters complained about the long lines in some precincts, with most complaints coming from precinct A. In 2004, the average number of voters arriving at Precinct A was 35 per hour and the arrivals of voters was random with inter-arrival times that had a coefficient of variation of 1 (CVa=1).Philadelphia deployed 1 voting machine in Precinct A. Suppose that each voter spent on average 100 seconds in the voting booth (this is the time needed to cast her/his vote using a voting machine), with a standard deviation of 120 seconds.Q1. How long on average did a voter have to wait in line at precinct A in 2004 beforeentering a booth to cast her/his vote?arrow_forwardIn a human population, the proportion of individuals with a certain disease is 0.10. if we select a sample of size 1000 from this population, determine the value of the variance of the sample proportion.arrow_forward
 Linear Algebra: A Modern IntroductionAlgebraISBN:9781285463247Author:David PoolePublisher:Cengage Learning