
Understandable Statistics: Concepts and Methods
12th Edition
ISBN: 9781337119917
Author: Charles Henry Brase, Corrinne Pellillo Brase
Publisher: Cengage Learning
expand_more
expand_more
format_list_bulleted
Concept explainers
Videos
Textbook Question
Chapter 9.2, Problem 6P
Critical Thinking: Interpreting Computer Printouts Refer to the description of a computer display for regression described in Problem 5. The following Minitab display gives information regarding the relationship between the body weight of a child (in kilograms) and the metabolic rate of the child (in 100 kcal/24 hr). The data is based on information from The Merck Manual (a commonly used reference in medical schools and nursing programs).
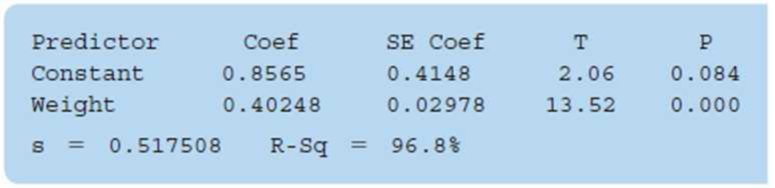
- (a) Write out the least-squares equation.
- (b) For each 1-kilogram increase in weight, how much does the metabolic rate of a child increase?
- (c) What is the value of the sample
correlation coefficient r? - (d) Interpretation What percentage of the variation in y can be explained by the corresponding variation in x and the least-squares line? What percentage is unexplained?
Expert Solution & Answer
Want to see the full answer?
Check out a sample textbook solution
Students have asked these similar questions
Problem 2
The following printout shows the results of a simple linear regression model that predicts monthly sales (in thousands of dollars) based on how much money was spent on advertising (in thousands of dollars) during a particular month for 15 stores of a retail chain.
a) Is there a statistically significant relationship between money spent on advertising and sales? Test at the 5% level of significance and explain your approach (including hypotheses).
b) Somebody claims that every additional $1,000 in advertising will increase sales by more than $2,000 in the population. Can you find support for this claim given the results of your analysis? Test at the 5% level of significance and explain your approach (including hypotheses). How is this test different from the one in part a)?
c) Find a 95% confidence interval for the change in sales given a $1,000 increase in the amount of money spent on advertising. How does this confidence interval relate to your answer to part a)?
What is the purpose of multiple linear regression?
a.
To assess whether there is a significant difference between independent groups
b.
To predict scores of an independent variable from scores of a single dependent variable
c.
To predict scores of a single dependent variable from scores on multiple independent variables
d.
To predict scores of an independent variable from scores on multiple dependent variables
The operations manager of a musical instrument distributor feels that the demand for Bass Drums may be related to the number of
television appearances by the popular rick group Green Shades during the previous month. The manager has collected the data shown
in the following table.
Demand for Bass Drums
3 6 7 5 10 8
Green Shades TV appearances
3 4 7 6 8 5
Develop the linear regression equation to forecast.
Forecast demand for Bass Drums when Green Shades’ TV appearances are 10.
Compute MSE and standard deviation for Problem 8.
Chapter 9 Solutions
Understandable Statistics: Concepts and Methods
Ch. 9.1 - Statistical Literacy When drawing a scatter...Ch. 9.1 - Prob. 2PCh. 9.1 - Prob. 3PCh. 9.1 - Prob. 4PCh. 9.1 - Prob. 5PCh. 9.1 - Prob. 6PCh. 9.1 - Prob. 7PCh. 9.1 - Prob. 8PCh. 9.1 - Prob. 9PCh. 9.1 - Critical Thinking: Lurking Variables Over the past...
Ch. 9.1 - Prob. 11PCh. 9.1 - Prob. 12PCh. 9.1 - Prob. 13PCh. 9.1 - Health Insurance: Administrative Cost The...Ch. 9.1 - Prob. 15PCh. 9.1 - Geology: Earthquakes Is the magnitude of an...Ch. 9.1 - Prob. 17PCh. 9.1 - Prob. 18PCh. 9.1 - Prob. 19PCh. 9.1 - Prob. 20PCh. 9.1 - Prob. 21PCh. 9.1 - Prob. 22PCh. 9.1 - Prob. 23PCh. 9.1 - Prob. 24PCh. 9.2 - Statistical Literacy In the least-squares line...Ch. 9.2 - Prob. 2PCh. 9.2 - Critical Thinking When we use a least-squares line...Ch. 9.2 - Prob. 4PCh. 9.2 - Prob. 5PCh. 9.2 - Critical Thinking: Interpreting Computer Printouts...Ch. 9.2 - Prob. 7PCh. 9.2 - For Problems 718, please do the following. (a)...Ch. 9.2 - Prob. 9PCh. 9.2 - For Problems 718, please do the following. (a)...Ch. 9.2 - Prob. 11PCh. 9.2 - Prob. 12PCh. 9.2 - For Problems 718, please do the following. (a)...Ch. 9.2 - Prob. 14PCh. 9.2 - Prob. 15PCh. 9.2 - For Problems 718, please do the following. (a)...Ch. 9.2 - Prob. 17PCh. 9.2 - Prob. 18PCh. 9.2 - Prob. 19PCh. 9.2 - Residual Plot: Miles per Gallon Consider the data...Ch. 9.2 - Prob. 21PCh. 9.2 - Prob. 22PCh. 9.2 - Prob. 23PCh. 9.2 - Prob. 24PCh. 9.2 - Prob. 25PCh. 9.3 - Prob. 1PCh. 9.3 - Prob. 2PCh. 9.3 - Prob. 3PCh. 9.3 - Prob. 4PCh. 9.3 - Prob. 5PCh. 9.3 - Prob. 6PCh. 9.3 - Prob. 7PCh. 9.3 - In Problems 712, parts (a) and (b) relate to...Ch. 9.3 - Prob. 9PCh. 9.3 - Prob. 10PCh. 9.3 - In Problems 712, parts (a) and (b) relate to...Ch. 9.3 - Prob. 12PCh. 9.3 - Prob. 13PCh. 9.3 - Prob. 14PCh. 9.3 - Prob. 15PCh. 9.3 - Expand Your Knowledge: Time Series and Serial...Ch. 9.3 - Prob. 17PCh. 9.4 - Statistical Literacy Given the linear regression...Ch. 9.4 - Prob. 2PCh. 9.4 - For Problems 3-6, use appropriate multiple...Ch. 9.4 - For Problems 3-6, use appropriate multiple...Ch. 9.4 - Prob. 5PCh. 9.4 - Prob. 6PCh. 9 - Prob. 1CRPCh. 9 - Prob. 2CRPCh. 9 - Prob. 3CRPCh. 9 - Prob. 4CRPCh. 9 - Prob. 5CRPCh. 9 - Prob. 6CRPCh. 9 - Prob. 7CRPCh. 9 - Prob. 8CRPCh. 9 - Prob. 9CRPCh. 9 - Prob. 10CRPCh. 9 - Prob. 1DHCh. 9 - Prob. 1LCCh. 9 - Prob. 1UTCh. 9 - Prob. 2UTCh. 9 - Prob. 3UTCh. 9 - Prob. 4UTCh. 9 - Prob. 5UTCh. 9 - Prob. 6UTCh. 9 - Prob. 7UTCh. 9 - In Problems 16, please use the following steps (i)...Ch. 9 - Prob. 2CURPCh. 9 - Prob. 3CURPCh. 9 - Prob. 4CURPCh. 9 - Prob. 5CURPCh. 9 - Prob. 6CURPCh. 9 - Prob. 8CURPCh. 9 - Linear Regression: Blood Glucose Let x be a random...
Knowledge Booster


Learn more about
Need a deep-dive on the concept behind this application? Look no further. Learn more about this topic, statistics and related others by exploring similar questions and additional content below.Similar questions
- Suppose Wesley is a marine biologist who is interested in the relationship between the age and the size of male Dungeness crabs. Wesley collects data on 1,000 crabs and uses the data to develop the following least-squares regression line where ?X is the age of the crab in months and ?ˆY^ is the predicted value of ?Y, the size of the male crab in cm. ?ˆ=9.5603+0.3976?Y^=9.5603+0.3976X What is the value of ?ˆY^ when a male crab is 24.9118 months old? Provide your answer with precision to two decimal places. Y=arrow_forwardA box office analyst seeks to predict opening weekend box office gross for movies. Toward this goal, the analyst plans to use online trailer views as a predictor. For each of the 66 movies, the number of online trailer views from the release of the trailer through the Saturday before a movie opens and the opening weekend box office gross (in millions of dollars) are collected and stored in the accompanying table. The least-squares regression equation for these data isYi=−0.914+1.408Xi and the standard error of the estimate is SYX=19.887. Assume that the straight-line model is appropriate and there are no serious violations the assumptions of the least-squares regression model. Compute the test statistic.arrow_forwardSuppose Tatiyana is interested in the relationship between language ability and time spent reading. She randomly selects a sample of 30 students from the local high school and collects their scores from a language aptitude test. She surveys the sample asking each student how many hours per month he or she spends reading. Using the sample data, Tatiyana produces a scatterplot with reading time on the horizontal axis and language test scores on the vertical axis. She develops a least squares regression equation where ? is the amount of time spent reading during the month and ?̂ is the predicted value of the language test score. ?̂=3.251x+31.237 Compute the value of ?̂ when a student spends 42 hours reading. Give your answer precise to one decimal place. Avoid rounding until the last step. ?̂= ? points Identify all of the true statements regarding the interpretation of ?̂ when ?=42. The value of ?̂ is ? a. the predicted number of students that read for 42 hours. b. the language test…arrow_forward
- In a statistics course, a linear regression equation was computed to predict the final exam score from the score on the midterm exam. The equation of the least‑squares regression line was ?̂ =10+0.9?, where ?y represents the final exam score and ?x is the midterm exam score. Suppose Joe scores an 80 on the midterm exam. What would be the predicted value of his score on the final exam?arrow_forwardSuppose Wesley is a marine biologist who is interested in the relationship between the age and the size of male Dungeness crabs. Wesley collects data on 1,000 crabs and uses the data to develop the following least-squares regression line where ?X is the age of the crab in months and ?ˆY^ is the predicted value of ?Y, the size of the male crab in cm. ?ˆ=8.2052+0.5693?Y^=8.2052+0.5693X What is the value of ?ˆY^ when a male crab is 21.7865 months old? Provide your answer with precision to two decimal places. ?ˆ= Interpret the value of ?ˆ. The value of ?ˆ is the predicted number of crabs out of the 1,000 crabs collected that will be 21.7865 months old. the probability that a crab will be 21.7865 months old. the predicted size of a crab when it is 21.7865 months old. the predicted incremental increase in size for every increase in age by 21.7865 months.arrow_forwardSuppose Wesley is a marine biologist who is interested in the relationship between the age and the size of male Dungeness crabs. Wesley collects data on 1,000 crabs and uses the data to develop the following least-squares regression line where ?X is the age of the crab in months and ?ˆY^ is the predicted value of ?Y, the size of the male crab in cm. ?ˆ=8.2052+0.5693? What is the value of ?^ when a male crab is 21.7865 months old? Provide your answer with precision to two decimal places. Y^ = Interpret the value of Y^.arrow_forward
- When there is no relationship between the independent variable and the dependent variable, the slope of the regression line is: Question 10 options: zero infinite negative positivearrow_forward20 Suppose Wesley is a marine biologist who is interested in the relationship between the age and the size of male Dungeness crabs. Wesley collects data on 1,000 crabs and uses the data to develop the following least-squares regression line where ?X is the age of the crab in months and ?ˆY^ is the predicted value of ?Y, the size of the male crab in cm. ?ˆ=8.2052+0.5693?Y^=8.2052+0.5693X What is the value of ?ˆY^ when a male crab is 21.7865 months old? Provide your answer with precision to two decimal places. ?ˆY^ = Interpret the value of ?ˆY^. The value of ?ˆY^ is the probability that a crab will be 21.7865 months old. the predicted incremental increase in size for every increase in age by 21.7865 months. the predicted size of a crab when it is 21.7865 months old. the predicted number of crabs out of the 1,000 crabs collected that will be 21.7865 months old.arrow_forward
arrow_back_ios
arrow_forward_ios
Recommended textbooks for you
 MATLAB: An Introduction with ApplicationsStatisticsISBN:9781119256830Author:Amos GilatPublisher:John Wiley & Sons Inc
 Probability and Statistics for Engineering and th...StatisticsISBN:9781305251809Author:Jay L. DevorePublisher:Cengage Learning
 Statistics for The Behavioral Sciences (MindTap C...StatisticsISBN:9781305504912Author:Frederick J Gravetter, Larry B. WallnauPublisher:Cengage Learning
 Elementary Statistics: Picturing the World (7th E...StatisticsISBN:9780134683416Author:Ron Larson, Betsy FarberPublisher:PEARSON
 The Basic Practice of StatisticsStatisticsISBN:9781319042578Author:David S. Moore, William I. Notz, Michael A. FlignerPublisher:W. H. Freeman
 Introduction to the Practice of StatisticsStatisticsISBN:9781319013387Author:David S. Moore, George P. McCabe, Bruce A. CraigPublisher:W. H. Freeman
MATLAB: An Introduction with Applications
Statistics
ISBN:9781119256830
Author:Amos Gilat
Publisher:John Wiley & Sons Inc
Probability and Statistics for Engineering and th...
Statistics
ISBN:9781305251809
Author:Jay L. Devore
Publisher:Cengage Learning
Statistics for The Behavioral Sciences (MindTap C...
Statistics
ISBN:9781305504912
Author:Frederick J Gravetter, Larry B. Wallnau
Publisher:Cengage Learning
Elementary Statistics: Picturing the World (7th E...
Statistics
ISBN:9780134683416
Author:Ron Larson, Betsy Farber
Publisher:PEARSON
The Basic Practice of Statistics
Statistics
ISBN:9781319042578
Author:David S. Moore, William I. Notz, Michael A. Fligner
Publisher:W. H. Freeman
Introduction to the Practice of Statistics
Statistics
ISBN:9781319013387
Author:David S. Moore, George P. McCabe, Bruce A. Craig
Publisher:W. H. Freeman
Correlation Vs Regression: Difference Between them with definition & Comparison Chart; Author: Key Differences;https://www.youtube.com/watch?v=Ou2QGSJVd0U;License: Standard YouTube License, CC-BY
Correlation and Regression: Concepts with Illustrative examples; Author: LEARN & APPLY : Lean and Six Sigma;https://www.youtube.com/watch?v=xTpHD5WLuoA;License: Standard YouTube License, CC-BY