
Understandable Statistics: Concepts and Methods
12th Edition
ISBN: 9781337119917
Author: Charles Henry Brase, Corrinne Pellillo Brase
Publisher: Cengage Learning
expand_more
expand_more
format_list_bulleted
Concept explainers
Videos
Textbook Question
Chapter 9.4, Problem 3P
For Problems 3-6, use appropriate multiple regression software of your choice and enter the data. Note that the data are also available for download at the Companion Sites for this text.
3. Medical: Blood Pressure The systolic blood pressure of individuals is thought to be related to both age and weight. For a random sample of 11 men, the following data were obtained:
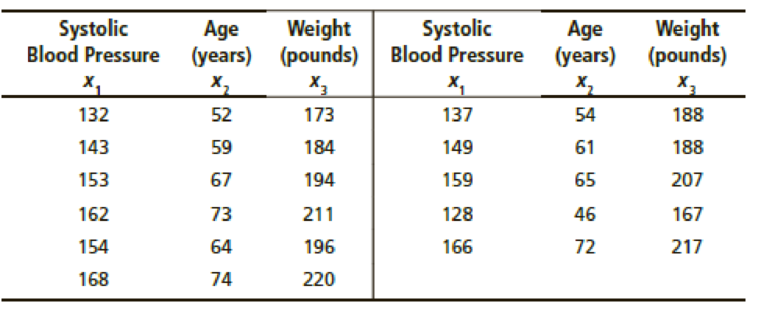
- (a) Generate summary statistics, including the
mean and standard deviation of each variable. Compute the coefficient of variation (see Section 3.2) for each variable. Relative to its mean, which variable has the greatest spread of data values? Which variable has the smallest spread of data values relative to its mean? - (b) For each pair of variables, generate the sample
correlation coefficient r. Compute the corresponding coefficient of determination r2. Which variable (other than x1) has the greatest influence (by itself) on x1? Would you say that both variables x2 and x3 show a strong influence on x1? Explain your answer. What percent of the variation in x1 can be explained by the corresponding variation in x2? Answer the same question for x3. - (c) Perform a
regression analysis with x1 as the response variable. Use x2 and x3 as explanatory variables. Look at the coefficient of multiple determination. What percentage of the variation in x1 can be explained by the corresponding variations in x3 and x3 taken together? - (d) Look at the coefficients of the regression equation. Write out the regression equation. Explain how each coefficient can be thought of as a slope. If age were held fixed, but a person put on 10 pounds, what would you expect for the corresponding change in systolic blood pressure? If a person kept the same weight but got 10 years older, what would you expect for the corresponding change in systolic blood pressure?
- (e) Test each coefficient to determine if it is zero or not zero. Use level of significance 5%. Why would the outcome of each test help us determine whether or not a given variable should be used in the regression model?
- (f) Find a 90% confidence interval for each coefficient.
- (g) Suppose Michael is 68 years old and weighs 192 pounds. Predict his systolic blood pressure, and find a 90% confidence
range for your prediction (if your software produces prediction intervals).
Expert Solution & Answer
Want to see the full answer?
Check out a sample textbook solution
Students have asked these similar questions
Use the dataset in Table 2 to answer the questions. The table shows the ages (in years) of seven children and the number of words in their vocabulary. For problems 9-12, use the regression equation found in question 7 to predict the value of for the values of given in each question unless it is not meaningful. If it is not meaningful to predict the value of for the -value, explain why not.
Table 2. Vocabulary
Age
Vocabulary
3
1100
4
1300
4
1500
5
2100
6
2600
2
460
3
1200
7. What is the equation of the regression line?
8. Construct a scatter plot for the data showing the regression line on the same graph.
For problems 9-12, see the instructions above.
9. x=2years
10. x=3years
11. x=6years
12. x=12years
Question 3.
Calculate and interpret the regression line for the data.
A manager wishes to determine the relationship between the number of years her sales representatives have been employed by the firm and their amount of sales (in thousands of dollars) per month. Find the equation of the regression line for the given data.
Chapter 9 Solutions
Understandable Statistics: Concepts and Methods
Ch. 9.1 - Statistical Literacy When drawing a scatter...Ch. 9.1 - Prob. 2PCh. 9.1 - Prob. 3PCh. 9.1 - Prob. 4PCh. 9.1 - Prob. 5PCh. 9.1 - Prob. 6PCh. 9.1 - Prob. 7PCh. 9.1 - Prob. 8PCh. 9.1 - Prob. 9PCh. 9.1 - Critical Thinking: Lurking Variables Over the past...
Ch. 9.1 - Prob. 11PCh. 9.1 - Prob. 12PCh. 9.1 - Prob. 13PCh. 9.1 - Health Insurance: Administrative Cost The...Ch. 9.1 - Prob. 15PCh. 9.1 - Geology: Earthquakes Is the magnitude of an...Ch. 9.1 - Prob. 17PCh. 9.1 - Prob. 18PCh. 9.1 - Prob. 19PCh. 9.1 - Prob. 20PCh. 9.1 - Prob. 21PCh. 9.1 - Prob. 22PCh. 9.1 - Prob. 23PCh. 9.1 - Prob. 24PCh. 9.2 - Statistical Literacy In the least-squares line...Ch. 9.2 - Prob. 2PCh. 9.2 - Critical Thinking When we use a least-squares line...Ch. 9.2 - Prob. 4PCh. 9.2 - Prob. 5PCh. 9.2 - Critical Thinking: Interpreting Computer Printouts...Ch. 9.2 - Prob. 7PCh. 9.2 - For Problems 718, please do the following. (a)...Ch. 9.2 - Prob. 9PCh. 9.2 - For Problems 718, please do the following. (a)...Ch. 9.2 - Prob. 11PCh. 9.2 - Prob. 12PCh. 9.2 - For Problems 718, please do the following. (a)...Ch. 9.2 - Prob. 14PCh. 9.2 - Prob. 15PCh. 9.2 - For Problems 718, please do the following. (a)...Ch. 9.2 - Prob. 17PCh. 9.2 - Prob. 18PCh. 9.2 - Prob. 19PCh. 9.2 - Residual Plot: Miles per Gallon Consider the data...Ch. 9.2 - Prob. 21PCh. 9.2 - Prob. 22PCh. 9.2 - Prob. 23PCh. 9.2 - Prob. 24PCh. 9.2 - Prob. 25PCh. 9.3 - Prob. 1PCh. 9.3 - Prob. 2PCh. 9.3 - Prob. 3PCh. 9.3 - Prob. 4PCh. 9.3 - Prob. 5PCh. 9.3 - Prob. 6PCh. 9.3 - Prob. 7PCh. 9.3 - In Problems 712, parts (a) and (b) relate to...Ch. 9.3 - Prob. 9PCh. 9.3 - Prob. 10PCh. 9.3 - In Problems 712, parts (a) and (b) relate to...Ch. 9.3 - Prob. 12PCh. 9.3 - Prob. 13PCh. 9.3 - Prob. 14PCh. 9.3 - Prob. 15PCh. 9.3 - Expand Your Knowledge: Time Series and Serial...Ch. 9.3 - Prob. 17PCh. 9.4 - Statistical Literacy Given the linear regression...Ch. 9.4 - Prob. 2PCh. 9.4 - For Problems 3-6, use appropriate multiple...Ch. 9.4 - For Problems 3-6, use appropriate multiple...Ch. 9.4 - Prob. 5PCh. 9.4 - Prob. 6PCh. 9 - Prob. 1CRPCh. 9 - Prob. 2CRPCh. 9 - Prob. 3CRPCh. 9 - Prob. 4CRPCh. 9 - Prob. 5CRPCh. 9 - Prob. 6CRPCh. 9 - Prob. 7CRPCh. 9 - Prob. 8CRPCh. 9 - Prob. 9CRPCh. 9 - Prob. 10CRPCh. 9 - Prob. 1DHCh. 9 - Prob. 1LCCh. 9 - Prob. 1UTCh. 9 - Prob. 2UTCh. 9 - Prob. 3UTCh. 9 - Prob. 4UTCh. 9 - Prob. 5UTCh. 9 - Prob. 6UTCh. 9 - Prob. 7UTCh. 9 - In Problems 16, please use the following steps (i)...Ch. 9 - Prob. 2CURPCh. 9 - Prob. 3CURPCh. 9 - Prob. 4CURPCh. 9 - Prob. 5CURPCh. 9 - Prob. 6CURPCh. 9 - Prob. 8CURPCh. 9 - Linear Regression: Blood Glucose Let x be a random...
Knowledge Booster


Learn more about
Need a deep-dive on the concept behind this application? Look no further. Learn more about this topic, statistics and related others by exploring similar questions and additional content below.Similar questions
- For the following exercises, consider the data in Table 5, which shows the percent of unemployed in a city ofpeople25 years or older who are college graduates is given below, by year. 41. Based on the set of data given in Table 7, calculatethe regression line using a calculator or othertechnology tool, and determine the correlationcoefficient to three decimal places.arrow_forwardFor the following exercises, consider the data in Table 5, which shows the percent of unemployed ina city of people 25 years or older who are college graduates is given below, by year. 40. Based on the set of data given in Table 6, calculate the regression line using a calculator or other technology tool, and determine the correlation coefficient to three decimal places.arrow_forwardAssume we have a population data, and the following values were obtained Mean of X=6, Standard deviation =2 Mean of Y = 11, standard deviation =3 R=-0.4. What is the slope and intercept of the regression line?arrow_forward
- Find the equation of the regression line for the given dataarrow_forwardGiven that the sum of squares for error is 60 and the sum of squares for regression is 140, then the coefficient of determination is:arrow_forwardIf you know that the equation for the simple linear regression between the final exam result and the mid-year examination result for students in the engineering statistics subject is as follows final exam: 50+0.5 x. midterm The regression coefficient is?arrow_forward
- Problem 2 The following printout shows the results of a simple linear regression model that predicts monthly sales (in thousands of dollars) based on how much money was spent on advertising (in thousands of dollars) during a particular month for 15 stores of a retail chain. a) Is there a statistically significant relationship between money spent on advertising and sales? Test at the 5% level of significance and explain your approach (including hypotheses). b) Somebody claims that every additional $1,000 in advertising will increase sales by more than $2,000 in the population. Can you find support for this claim given the results of your analysis? Test at the 5% level of significance and explain your approach (including hypotheses). How is this test different from the one in part a)? c) Find a 95% confidence interval for the change in sales given a $1,000 increase in the amount of money spent on advertising. How does this confidence interval relate to your answer to part a)?arrow_forwardGiven the following, determine the price of a Corolla that is six years old given the graph of the regression line.arrow_forwardDiscuss the two forms of the regression equation, raw score and z score, and their verbal interpretations. When is each form of the analysis more useful?arrow_forward
- Find the regression line equation for the following data (formula or calculator). X 2 3 5 6 Y 4 9 14 20arrow_forwardFor the simple regression equation (a), conduct an individual significance tests at the 5% significance level to determine if SQFT is a significant predictor of Price. (Check photo for data)arrow_forwardHow much would a 30 year-old, 1,500 square foot, 3 bedroom, non-brick house be worth based on your adjusted regression equation after deleting any insignificant variables?arrow_forward
arrow_back_ios
SEE MORE QUESTIONS
arrow_forward_ios
Recommended textbooks for you

 Functions and Change: A Modeling Approach to Coll...AlgebraISBN:9781337111348Author:Bruce Crauder, Benny Evans, Alan NoellPublisher:Cengage Learning
Functions and Change: A Modeling Approach to Coll...
Algebra
ISBN:9781337111348
Author:Bruce Crauder, Benny Evans, Alan Noell
Publisher:Cengage Learning
Correlation Vs Regression: Difference Between them with definition & Comparison Chart; Author: Key Differences;https://www.youtube.com/watch?v=Ou2QGSJVd0U;License: Standard YouTube License, CC-BY
Correlation and Regression: Concepts with Illustrative examples; Author: LEARN & APPLY : Lean and Six Sigma;https://www.youtube.com/watch?v=xTpHD5WLuoA;License: Standard YouTube License, CC-BY