
Concept explainers
Videos
In Problems 7–12, parts (a) and (b) relate to testing ρ. Part (c) requests the value of Se. Parts (d) and (e) relate to confidence intervals for prediction. Parts (f) and (g) relate to testing β and finding confidence intervals for β.
Answers may vary due to rounding.
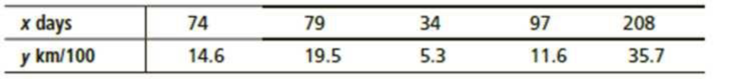
11. Oceanography: Drift Rates Ocean currents are important in studies of climate change, as well as ecology studies of dispersal of plankton. Drift bottles are used to study ocean currents in the Pacific near Hawaii, the Solomon Islands, New Guinea, and other islands. Let x represent the number of days to recovery of a drift bottle after release and y represent the distance from point of release to point of recovery in km/100. The following data are taken from the reference by Professor E.A. Kay, University of Hawaii.
Reference: A Natural History of the Hawaiian Islands, edited by E. A. Kay, University of Hawaii Press.
- (a) Verify that ∑x = 492, ∑y = 86.7, ∑x2 = 65,546, ∑y2 = 2030.55, ∑xy = 11351.9, and r ≈ 0.93853.
- (b) Use a 1% level of significance to test the claim ρ > 0.
- (c) Verify that Se ≈ 4.5759, a ≈ 1.1405, and b ≈ 0.1646
- (d) Find the predicted distance (km/100) when a drift bottle has been floating for 90 days.
- (e) Find a 90% confidence interval for your prediction of part (d).
- (f) Use a 1% level of significance to test the claim that β > 0.
- (g) Find a 95% confidence interval for β and interpret its meaning in terms of drift rate.
- (h) Consider the following scenario. A sailboat had an accident and radioed a Mayday alert with a given latitude and longitude just before it sank. The survivors are in a small (but well provisioned) life raft drifting in the part of the Pacific Ocean under study. After 30 days, how far from the accident site should a rescue plane expect to look?
Want to see the full answer?
Check out a sample textbook solution
Chapter 9 Solutions
Understandable Statistics: Concepts and Methods


- Problem 3: Please answer parts a, b, and c! A sample of 136 hypertensive people were given an anti-hypertensive drug, and the drug was found to be effective in 49 of those people. (By effective, we mean that their diastolic blood pressure is lowered by at least 10 mm Hg as judged from a repeat measurement taken 1 month after taking the drug.) (a) Find a 90% confidence interval for the true proportion of the sampled population for which the drug is effective. (b) Using the results from the above mentioned survey, how many people should be sampled to estimate the true proportion of hypertensive people for which the drug is effective to within 4% with 96% confidence? (c) If no previous estimate of the sample proportion is available, how large of a sample should be used in (b)?arrow_forwardQuestion 1 Scenario 1: The city of Pawnee wants to see how their high school seniors' SAT scores compare to the SAT scores of the rest of the country. What is the most appropriate test statistic to use to test the hypothesis in scenario 1? (out of these choices) A) One way ANOVA B) One sample z-test C) Correlation coefficient D) Dependent samples t test E) Independent samples t-test F) Regression G) Z-score Question 2 - What is the null hypothesis for scenario 1?A )H0: m (sample) = µ (population) B) H0: m1 (sample) m2 (population) C) H0: m (population) µ (sample) D) H0: X (sample) > µ (population) E) r > 0 F) H0: m1 (sample) = m2 (population) = m3 (control) What is the alternative hypothesis for scenario 1? A) H1: m1 < m2 B) H1: m ≠ µ C) H1: m1 ≠ m2 ≠ m3 D) r ≠ 0arrow_forward
 MATLAB: An Introduction with ApplicationsStatisticsISBN:9781119256830Author:Amos GilatPublisher:John Wiley & Sons Inc
 Probability and Statistics for Engineering and th...StatisticsISBN:9781305251809Author:Jay L. DevorePublisher:Cengage Learning
 Statistics for The Behavioral Sciences (MindTap C...StatisticsISBN:9781305504912Author:Frederick J Gravetter, Larry B. WallnauPublisher:Cengage Learning
 Elementary Statistics: Picturing the World (7th E...StatisticsISBN:9780134683416Author:Ron Larson, Betsy FarberPublisher:PEARSON
 The Basic Practice of StatisticsStatisticsISBN:9781319042578Author:David S. Moore, William I. Notz, Michael A. FlignerPublisher:W. H. Freeman
 Introduction to the Practice of StatisticsStatisticsISBN:9781319013387Author:David S. Moore, George P. McCabe, Bruce A. CraigPublisher:W. H. Freeman