
Videos
Antipsychotic drugs are widely prescribed for conditions such as schizophrenia and bipolar disease. The article “Cardiometabolic Risk of Second- Generation Antipsychotic Medications During First-Time Use in Children and Adolescents” (J. of the Amer. Med. Assoc., 2009) reported on body composition and metabolic changes for individuals who had taken various antipsychotic drugs for short periods of time.
a. The sample of 41 individuals who had taken aripiprazole had a mean change in total cholesterol (mg/dL) of 3.75, and the estimated standard error
b. The article also reported that for a sample of 36 individuals who had taken quetiapine, the sample mean cholesterol level change and estimated standard error were 9.05 and 4.256, respectively. Making any necessary assumptions about the distribution of change in cholesterol level, does the choice of significance level impact your conclusion as to whether true average cholesterol level increases? Explain. [Note: The article included a P-value.] c. For the sample of 45 individuals who had taken olanzapine, the article reported (7.38, 9.69) as a 95% CI for true average weight gain (kg). What is a 99% CI?
a.
Calculate the 95% confidence interval for the true average increase in total cholesterol.
Answer to Problem 41E
The 95% confidence interval for the true average increase in total cholesterol lies between –3.85 and 11.35.
Explanation of Solution
Given info:
The information is based on selecting a sample of 41 individuals has been taken antipsychotic drugs for the short period of time has the mean of 3.75 and the estimated standard error of 3.878.
Calculation:
Let
Confidence interval:
The confidence interval using large sample method is,
Where
Confidence interval:
Step-by-step procedure to obtain the confidence interval using the MINITAB software:
- Choose Stat > Basic Statistics > One sample Z.
- Choose Summarized columns. Enter the Sample size as 41, Mean as 3.78 and Standard deviation as 24.8.
- In Perform hypothesis test, enter the 0.
- Choose Options.
- In Confidence level, enter 95.
- In Alternative, select Not equal.
- Click OK in all the dialog boxes.
Output using the MINITAB software is given below:
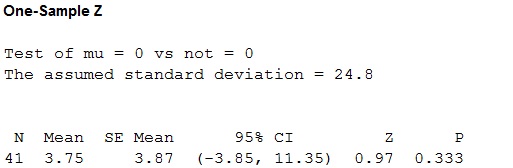
From the MINITAB output, the confidence interval is (–3.85,11.35).
Thus, the 95% confidence interval for the true average increase in total cholesterol lies between –3.85 and 11.35.
Interpretation:
There is 95% confident that the true average increase in total cholesterol lies between –3.85 and 11.35.
b.
Explain whether the choice of significance level impact the conclusion that the true average cholesterol level under the quetiapine is positive.
Answer to Problem 41E
The data provides the sufficient evidence that the true average cholesterol level under the quetiapine is positive at the level of significance of 5%.
Explanation of Solution
Given info:
The information is based on selecting a sample of 36 individuals has been taken quetiapine drugs for the short period of time has the mean of 9.05 and the estimated standard error of 4.256.
Calculation:
Let
Assume that the level of significance is 0.05.
The test hypotheses are,
Null hypothesis:
That is, the true mean change in the total cholesterol under quetiapine is same.
Alternative hypothesis:
That is, the true mean change in the total cholesterol quetiapine is positive.
Requirements for a paired t-test:
- The sample X and Y taken from the population is selected at random.
- The samples X and Y are dependent of each other.
- Samples must be distributed to normal.
Here, the samples selected at random and dependent. Moreover, the sample size is assumed to be normally distributed. Hence, the assumptions are satisfied.
Test statistic:
The test statistic is,
Where
The test statistic is obtained given below:
Substitute
The test statistic is 2.13
The P- value is obtained by
As there are 36 individuals , thus
Thus,
Rejection region:
If
If
Conclusion:
Here, the P-value is less than the level of significance.
That is,
Therefore, the decision is “reject the null hypothesis”.
Thus, there is enough evidence to infer that the true average cholesterol level under the quetiapine is positive at the level of significance of 5%.
c.
Find the 99% confidence interval for the true average weight gain.
Answer to Problem 41E
The 99% confidence interval for the true average weight gain is (7.02,10.06)
Explanation of Solution
Given info:
The information is based on selecting a sample of 45 individuals has been taken olanzapine has the 95% confidence interval of (7.38,9.69).
Calculation:
Confidence interval:
The confidence interval using large sample method is,
Where
The sample mean
The standard error of
Level of significance:
The level of significance for both-tailed test,
The 99% confidence interval for the true average weight gain is obtained as:
Substitute
Thus, there is 99% confidence that the true average weight gain lies between the interval 7.02 and 10.06.
Want to see more full solutions like this?
Chapter 9 Solutions
Probability and Statistics for Engineering and the Sciences


- Suppose a researcher is interested inthe effectiveness in a new childhood exercise program implemented in a SRS of schools across a particular county. In order to test the hypothesis that the new program decreases BMI (Kg/m2), the researcher takes a SRS of children from schools where the program is employed and a SRS from schools that do not employ the program and compares the results. Assume the following table represents the SRSs of students and their BMIs. Student intervention group BMI (kg/m2) Student control group BMI (kg/m2) A 18.6 A 21.6 B 18.2 B 18.9 C 19.5 C 19.4 D 18.9 D 22.6 E 24.1 F 23.6 A) Assuming that all the necessary conditions are met (normality, independence, etc.) carry out the appropriate statistical test to determine if the new exercise program is effective. Use an alpha level of 0.05. Do not assume equal variances.B) Construct a 95% confidence interval about your estimate for the average difference in BMI between the groups.arrow_forwardA paper investigated the driving behavior of teenagers by observing their vehicles as they left a high school parking lot and then again at a site approximately 1 2 mile from the school. Assume that it is reasonable to regard the teen drivers in this study as representative of the population of teen drivers. MaleDriver FemaleDriver 1.4 -0.2 1.2 0.5 0.9 1.1 2.1 0.7 0.7 1.1 1.3 1.2 3 0.1 1.3 0.9 0.6 0.5 2.1 0.5 (a) Use a .01 level of significance for any hypothesis tests. Data consistent with summary quantities appearing in the paper are given in the table. The measurements represent the difference between the observed vehicle speed and the posted speed limit (in miles per hour) for a sample of male teenage drivers and a sample of female teenage drivers. (Use ?males − ?females. Round your test statistic to two decimal places. Round your degrees of freedom down to the nearest whole number. Round your p-value to three decimal places.) t = df =…arrow_forwardAn automotive engineer is investigating two different types of metering devices for an electronic fuel injection system to determine whether they differ in their fuel mileage performance. The system is installed on 10 different cars, and a test is run with each metering device on each car. The data is provided below: Metering Device Car 1 2 1 17.6 16.8 2 19.4 20.0 3 18.2 17.6 4 17.1 16.4 5 15.3 16.0 6 15.9 15.9 7 16.3 16.5 8 18.0 18.4 9 17.3 16.4 10 19.1 20.1 Is there a significant difference between the means of the two metering devices? Use . Interpret the result in the context of the problem. An article in the journal Hazardous Waste and Hazardous Materials (Vol. 6, 1989) reported the results of an analysis of the weight of calcium in standard cement and cement doped with lead. Reduced levels of calcium would indicate that the hydration mechanism in the cement is blocked…arrow_forward
- A low-level CDC bureaucrat wants to please his boss by gathering evidence thatthe current government-mandated shutdown of society is not causing people’s mentalhealth to deteriorate, so that it can safely be continued for several years if anyexpert says it’s necessary.He polls a random sample of 1600 citizens, gathering data on such items asincome loss, weight gain, access to toilet paper, hours spent binge-watchingNetflix, and number of injuries caused by household fights, and compiles all thisinto a scientifically-weighted “misery index”.The mean misery index from the sample is 99.2; it seems reasonable to use apopulation standard deviation σ = 19.1.a) Does this information provide significant evidence (at the 5% level) that thenationwide mean misery index is less than 100? Set up appropriate null andalternative hypotheses, calculate the appropriate test statistic, find the P-value,and state your conclusion. (10)b) A CDC press release publishing the results of this study claims that…arrow_forwardA low-level CDC bureaucrat wants to please his boss by gathering evidence thatthe current government-mandated shutdown of society is not causing people’s mentalhealth to deteriorate, so that it can safely be continued for several years if anyexpert says it’s necessary.He polls a random sample of 1600 citizens, gathering data on such items asincome loss, weight gain, access to toilet paper, hours spent binge-watchingNetflix, and number of injuries caused by household fights, and compiles all thisinto a scientifically-weighted “misery index”.The mean misery index from the sample is 99.2; it seems reasonable to use apopulation standard deviation σ = 19.1.a) Does this information provide significant evidence (at the 5% level) that thenationwide mean misery index is less than 100? Set up appropriate null andalternative hypotheses, calculate the appropriate test statistic, find the P-value,and state your conclusion. b) A CDC press release publishing the results of this study claims that…arrow_forwardIn a study conducted in the Science Department of Faculty of Science, Technology and Human Development in a University; the researcher examined the influence of the drug succinylcholine on the circulation levels of androgens in the blood. Blood samples from wild, free-ranging deer were obtained via the jugular vein immediately after an intramuscular injection of succinylcholine using darts and a capture gun. Deer were bled again approximately 30 minutes after the injection and then released. The level of androgens at time of capture and 30 minutes later, measured in nanograms per milliliter (ng/ml), for 15 deers as in Table Q1. Assuming that the populations of androgen at time of injection and 30 minutes later are normally distributed:i) Find the average and standard deviation of this studyii)Determine the critical region of this problem.iii) Test at the 0.05 level of significance whether the androgen concentrations are altered after 30 minutes of restraint.arrow_forward
- Suppose that, as part of a research methods class, Bailey was asked to write a summary of a research paper on the topic of the effects of oil contamination in soil on seed germination rates. Identify the explanatory and the response variables.arrow_forwardThe Diabetes Control and Complications trial research group, randomly assigned volunteers with type 1 (insulin-dependent) diabetes mellitus, but without retinopathy, either to a conventional treatment or to a more intensive treatment aimed at maintaining normal blood glucose levels. The volunteers' health was monitored closely for approximately six years. By the end of the study, 91 patients out of 378 in the conventional treatment group had developed retinopathy, whereas 23 out of 348 in the intensive treatment group had developed retinopathy. Test whether the rates of retinopathy differed significantly between the two treatment groups, if they did, which rate was significantly lower. 1. Provide the null hypothesis 2. Provide the alternative hypotheses 3. calculate the appropriate test statistic. Show all work 4. Identify the p-value for that test statistic 5. Using the p-value method and an alpha level of 0.02 state what your conclusions are regarding the null hypothesis, and…arrow_forwardThe Diabetes Control and Complications trial research group, randomly assigned volunteers with type 1 (insulin-dependent) diabetes mellitus, but without retinopathy, either to a conventional treatment or to a more intensive treatment aimed at maintaining normal blood glucose levels. The volunteers' health was monitored closely for approximately six years. By the end of the study, 91 patients out of 378 in the conventional treatment group had developed retinopathy, whereas 23 out of 348 in the intensive treatment group had developed retinopathy. Test wether the rates of retionpathy differed significantly betweenthe two treatment groups, if they did, which rate was significantly lower. 1. Provide the null hypothesis 2. Provide the alternative hypotheses 3. calculate the appropriate test statistic. Show all work 4. Indentify the p-value for that test statistic 5. Using the p-vlaue method and an alpha level of 0.02 state what your conclusions is regarding the null hypothesis, and…arrow_forward
- A heart study objective was to study heart disease among healthy volunteers.After a 10-year follow-up period involving men aged 40 to 59, there were 16 casesof coronary heart disease (CHD) among the 454 men who initially had cholesterollevels below 210 mg/100 ml (referred to as the low serum cholesterol group). Incontrast, among the 424 men whose initial cholesterol levels were at least 245mg/100 ml (referred to as the high serum cholesterol group), there were 51 cases ofCHD. With this information, Draw a 2x2 contingency table then calculate the relative risk (RR) associated with high serum cholesterol and provide an interpretation of the result.arrow_forwardRecently, researchers have begun to focus on the relationship between potentially toxic environmental exposures in children to a number of adverse health outcomes. Suppose one such researcher wants to investigate the relationship between lead levels in soil (micrograms/dL) and BMI (kg/m2). The following table represents a SRS of households with the corresponding exterior lead levels and BMI of a randomly sampled child in the home. Lead levels BMI 13.6 19.7 14.3 19.9 9.7 20.1 9.4 22.1 11.4 19.8 10.9 21.6 A) Write out the null and alternative hypotheses for a formal test of significance testing the correlation between the two variables and calulate a t statistic and interpret your pvalue and results.arrow_forwardThe following table was presented in a article summarizing a study to compare a new drug to a standard drug and to a placebo. characteristic new drug stand. drug placebo p age,yrs 45.2(4.8) 44.9(5.1) 42.8(4.3) 0.5746 % female 50% 55% 57% 0.1635 annual income,$000s 59.5%(14.3) 63.8(16.9) 58.2%(13.1) 0.4635 % w/ins 87% 65% 82% 0.0352 disease stage 0.0261 stage 1 35% 18% 33% stage 2 42% 37% 47% stage 3 23% 51% 20% Are there any statistiscally significant differences…arrow_forward
 Holt Mcdougal Larson Pre-algebra: Student Edition...AlgebraISBN:9780547587776Author:HOLT MCDOUGALPublisher:HOLT MCDOUGAL
 Glencoe Algebra 1, Student Edition, 9780079039897...AlgebraISBN:9780079039897Author:CarterPublisher:McGraw Hill