
Videos
Preliminary data analyses indicate that applying the z-test (Procedure 9.1 on page 388) in Exercises 9.83–9.88 is reasonable.
9.85 Iron Deficiency? Iron is essential to most life forms and to normal human physiology. It is an integral part of many proteins and enzymes that maintain good health. Recommendations for iron are provided in Dietary Reference Intakes, developed by the Institute of Medicine of the National Academy of Sciences. The recommended dietary allowance (RDA) of iron for adult females under the age of 51 is 18 milligrams (mg) per day. The following iron intakes, in milligrams, were obtained during a 24-hour period for 45 randomly selected adult females under the age of 51.
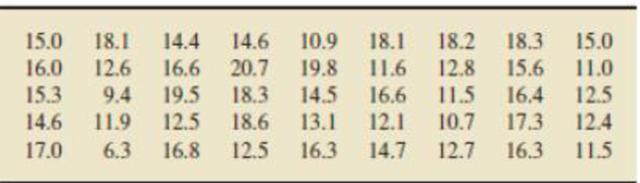
At the 1% significance level do the data suggest that adult females under the age of 51 are, on average, getting less than the RDA of 18 mg of iron? Assume that the population standard deviation is 4.2 mg.
(Note: x = 14.68 mg.)
Want to see the full answer?
Check out a sample textbook solution
Chapter 9 Solutions
Introductory Statistics (10th Edition)


- ) In the recent study, US graduates of for-profit higher institutions were between 4.8 and 6.7 percentage points more likely to ne unemployed than those at nonprofit institutions and community colleges. Determine the population, the sample, and population parameter of sample statistic. B) Explain the difference between Amelia making an 82 on her pre-calculus exam and scoring in the 82nd percentile in mathematics on the ACT test.arrow_forwardWhat does a statistically significant t test indicates?arrow_forward2. Describe what is measured by the estimated standard error in the bottom of the independent-measures t statistic.arrow_forward
- Indicate whether CPAs in states that have flat state income tax rates work fewer hours per week during tax season compared to the US average. You will want to formally set up H0 and Ha, report either the test statistic (z-value) or p-value, and explain why you either reject or fail to reject your null hypothesis.arrow_forward. Calculate the Z-test statistic using the standard error from part a. z=arrow_forwardA consumer group is investigating a producer of diet meals to examine if its prepackaged meals actually contain the advertised 6 ounces of protein in each package. Based on the following data, is there any evidence that the meals do not contain the advertised amount of protein? Run the appropriate test at a 5% level ofarrow_forward
- To combat antibiotic resistance, the Quality Improvement Consortium recommends a throat swab to confirm strep throat before a physician prescribes antibiotics to children under age 5. Nationally, 40 percent of children under 5 who received antibiotics did not have a throat swab. The Colorado Department of Health took a random sample of 60 children under the age of 5 who received antibiotics for throat infections and found that 18 did not have a throat swab. At α = .05, is this a statistically significant reduction over last year’s national rate of 40 percent? (a-1) Calculate the critical value. (A negative value should be indicated by a minus sign. Round your answer to 3 decimal places.) Critical value _____ (a-2) Calculate the test statistic. (A negative value should be indicated by a minus sign. Round your answer to 2 decimal places.) Test statistic _____arrow_forwardSince its removal from the banned substances list in 2004 by the World Anti-Doping Agency,caffeine has been used by athletes with the expectancy that it enhances their workout andperformance. However, few studies look at the role caffeine plays in sedentary females.Researchers at the University of Western Australia conducted a test in which they determined therate of energy expenditure (kilojoules) on 10 healthy, sedentary females who were nonregularcaffeine users. Each female was randomly assigned either a placebo or caffeine pill (6mg/kg) 60minutes prior to exercise. The subject rode an exercise bike for 15 minutes at 65% of theirmaximum heart rate, and the energy expenditure was measured. The process was repeated on aseparate day for the remaining treatment. The mean difference in energy expenditure (caffeine –placebo) was 18kJ with a standard deviation of 19kJ. If we assume that the differences follow anormal distribution can it be concluded that that caffeine appears to increase…arrow_forwardThe HSD test? A. maintain the type 1 error, b. maintains the type 1 error rate at alpha and is used for a post hoc comparisons, c. is used for post hoc comparisons, d. is used for planned comparisonsarrow_forward
- To combat antibiotic resistance, the Quality Improvement Consortium recommends a throat swab to confirm strep throat before a physician prescribes antibiotics to children under age 5. Nationally, 40 percent of children under 5 who received antibiotics did not have a throat swab. The Colorado Department of Health took a random sample of 100 children under the age of 5 who received antibiotics for throat infections and found that 30 did not have a throat swab. At α = .05, is this a statistically significant reduction over last year’s national rate of 40 percent? (a-1) Choose the correct null and alternative hypotheses. H0: π ≥ .40 vs. H1: π < .40 H0: π ≤ .40 vs. H1: π > .40 H0: π = .40 vs. H1: π ≠ .40 (a-2) Calculate the critical value. (A negative value should be indicated by a minus sign. Round your answer to 3 decimal places.) Critical value (a-3) Calculate the test statistic. (A negative value should be indicated by a minus sign. Round your…arrow_forward(1) Conduct a hypothesis test, at the 5% level of significance, to determine whether ? is significant (2) What would be the growth of the plant if 4g of fertilizer and 7g of ater was given to it daily? (3) Carry out an F -test at the 1% significance level to determine whether the model is significantarrow_forwardA Canadian study measuring depression level in teens (as reported in the Journal of Adolescence, vol. 25, 2002) randomly sampled 112 male teens and 101 female teens, and scored them on a common depression scale (higher score representing more depression). The researchers suspected that the mean depression score for male teens is higher than for female teens, and wanted to check whether data would support this hypothesis. What conclusion can you draw from the output? The data provide sufficient evidence to reject H0 and to conclude that the mean depression score for male teens is larger than that of female teens. The data provide sufficient evidence to conclude that male and female teens do not differ in mean depression score. The data do not provide sufficient evidence to conclude that the mean depression score of male teens is larger than that of female teens. The data do not provide sufficient evidence to reject H0, so we accept it, and conclude that male and female teens do…arrow_forward
 MATLAB: An Introduction with ApplicationsStatisticsISBN:9781119256830Author:Amos GilatPublisher:John Wiley & Sons Inc
 Probability and Statistics for Engineering and th...StatisticsISBN:9781305251809Author:Jay L. DevorePublisher:Cengage Learning
 Statistics for The Behavioral Sciences (MindTap C...StatisticsISBN:9781305504912Author:Frederick J Gravetter, Larry B. WallnauPublisher:Cengage Learning
 Elementary Statistics: Picturing the World (7th E...StatisticsISBN:9780134683416Author:Ron Larson, Betsy FarberPublisher:PEARSON
 The Basic Practice of StatisticsStatisticsISBN:9781319042578Author:David S. Moore, William I. Notz, Michael A. FlignerPublisher:W. H. Freeman
 Introduction to the Practice of StatisticsStatisticsISBN:9781319013387Author:David S. Moore, George P. McCabe, Bruce A. CraigPublisher:W. H. Freeman