
Videos
Preliminary data analyses indicate that you can reasonably use a t-test to conduct each of the hypothesis tests required in Exercises 9.113–9.118.
9.116 Apparel and Services. According to the document Consumer Expenditures, a publication of the Bureau of Labor Statistics, the average consumer unit spent $1736 on apparel and services in 2012, That same year 25 consumer units in the Northeast had the following annual expenditures, in dollars, on apparel and services.
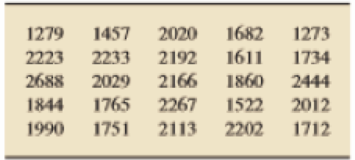
At the 5% significance level, do the data provide sufficient evidence to conclude that the 2012
Want to see the full answer?
Check out a sample textbook solution
Chapter 9 Solutions
Introductory Statistics (10th Edition)


- What is meant by the sample space of an experiment?arrow_forwardIn a qulaity control test of parts manufactured at Dabco Corporation, an engineer sampled parts produced on the first, second,and third shifts. The research study was designed to determine if the population proportion of good parts was the same for all three shifts. Sample data follow. a. Using a .05 level of significance, conduct a hypothesis test to determine if the population proportion of good parts is the same for all three shifts. What is the p-value and what is your conclusion? b. if the conclusion is that the population proportions are not all equal,use a multiple comparison procedure to determine how the shifts differ interms of quality. What shift or shifts need to improve the quality of parts produced?arrow_forwardBack in April and May 19 85 the Gallup organization conducted a pool to estimate the percentage of Americans who approved President Reagan was at the 5% significance level to the data suggest that the percentage of those who approved the Reagan increase in 1985? Population 1 April P=795/1528 = 0.5203 Population 2 May P=840/1528 = 0.5497.So all your steps setting up your Null and alternative hypothesisarrow_forward
- A survey organization conducted telephone interviews in December 2008 in which 1,009 randomly selected adults in the United States responded to the following question. At the present time, do you think television commercials are an effective way to promote a new product? Of the 1,009 adults surveyed, 676 responded “yes.” In December 2007, 622 of 1,020 randomly selected adults in the United States had responded “yes” to the same question. Do the data provide convincing evidence that the proportion of adults in the United States who would respond “yes” to the question changed from December 2007 to December 2008 ?arrow_forwardLooking for help on letter D A 2012 survey of 404 American adults indicates that 17% of cell phone owners do their browsing on their phone rather than a computer or other device. According to an online article, a report from a mobile research company indicates that 38% of Chinese mobile web users only access the internet through their cell phones. We wish to conduct a hypothesis test to determine if these data provide strong evidence that the proportion of Americans who only use their cell phones to access the internet is less than the Chinese proportion of 38%. (a) The Null Hypothesis, in mathematical symbols, is: H0: p = 0.38 (b) The Alternative Hypothesis, in mathematical symbols, is: HA : p < 0.38 In both the null and alternative hypotheses, the symbol is the proportion of American adult cell phone owners who do their browsing on their phone. (c) The standard error based on the null hypothesis is: 0.0241 (d) Our data indicates a proportion of Americans who use their phones…arrow_forwardA study of seat belt users and nonusers yielded the randomly selected sample data summarized in the accompanying table. Use a 0.05 significance level to test the claim that the amount of smoking is independent of seat belt use. A plausible theory is that people who smoke are less concerned about their health and safety and are therefore less inclined to wear seat belts. Is this theory supported by the sample data? Number of Cigarettes Smoked per Day 0 1–14 15–34 35 and over Wear Seat Belts 193 12 45 5 Don't Wear Seat Belts 147 21 32 a) determine the null and alternative hypotheses. b) find the test statistic. c) determine the P-value. d) does this reject or fail to reject the null hypothesis?arrow_forward
- A study of seat belt users and nonusers yielded the randomly selected sample data summarized in the accompanying table. Use a 0.05 significance level to test the claim that the amount of smoking is independent of seat belt use. A plausible theory is that people who smoke are less concerned about their health and safety and are therefore less inclined to wear seat belts. Is this theory supported by the sample data? Number of Cigarettes Smoked per Day 0 1–14 15–34 35 and over Wear Seat Belts 169 29 39 10 Don't Wear Seat Belts 153 24 34 11 a) determine the null and alternative hypothesis. b) what is the test statistic? c) whst is the P-value? d) use a significance level of 0.05 to test the claim that the amount of smoking is independent of seat belt use. A plausible theory is that people who smoke are less concerned about their health and safety and are therefore less inclined to wear seat belts. Is this…arrow_forwardUse the one-proportion z-test to perform the required hypothesis test. In a clinical study of an allergy drug, 109 of the 201 subjects reported experiencing significant relief from their symptoms. At the 0.01 significance level, do the data provide sufficient evidence to conclude that a majority of all those using the drug experience relief?arrow_forwardA study of seat belt users and nonusers yielded the randomly selected sample data summarized in the accompanying table. Use a 0.05 significance level to test the claim that the amount of smoking is independent of seat belt use. A plausible theory is that people who smoke are less concerned about their health and safety and are therefore less inclined to wear seat belts. Is this theory supported by the sample data? Number of Cigarettes Smoked Per Day 0 1-14 15-34 35 and over Wear Seat Belts 150 27 44 6 Don't Wear Seat Belts 151 21 45 8 (a) Determine the null and alternative hypotheses. A. H0: Heavy smokers are not less likely than non-smokers to wear a seat belt. H1: Heavy smokers are less likely than non-smokers to wear a seat belt. B. H0: Heavy smokers are less likely than non-smokers to wear a seat belt. H1: Heavy smokers are not less likely than non-smokers to wear a seat belt. C. H0: The amount of smoking is independent…arrow_forward
- The General Social Survey polled 1280 men and 1531 women to determine their level of education. The results are presented in the following table. Test at the 0.01 level of significance if education level is independent of gender. Education Level No High School Diploma High School Diploma Associate’s Degree Bachelor’s Degree Graduate Degree Men 178 608 96 248 150 Women 186 827 128 259 131 (a) State the hypotheses. (b) Statetheteststatistic. (c) CalculatetheP-value. (d) Makeadecision. (e) Statetheconclusionaddressingtheoriginalclaim.arrow_forward* In a certain state, a referendum is being held to determine whether the transportation authority should issue additional highway bonds. A sample of 430 voters is taken in county A, and 235 say that they favor the bond proposal. A sample of 500 voters is taken in county B, and 265 say that they favor the bond issue. Perform a hypothesis test to measure the strength of the evidence that the proportion of voters who favor the proposal is greater in county A than in county B. Use the a=0.02 level of significance. Use P Method and list all 6 steps clearly.arrow_forwardResearchers studying the link between prenatal vitamin use and autism surveyed the mothers of a random sample of children aged 24 - 60 months with autism and conducted another separate random sample for children with typical development. The table below shows the number of mothers in each group who did and did not use prenatal vitamins during the three months before pregnancy (periconceptional period). (Schmidt, 2011) Autism Typical Development Total No vitamin 111 70 181 Vitamin 143 159 302 Total 254 229 483 Complete the hypothesis test and state an appropriate conclusion.What is the value of the test statistic for this test? (Please round to two decimal places) What is the p-value associated with this test? (Please round to four decimal places)arrow_forward
 College Algebra (MindTap Course List)AlgebraISBN:9781305652231Author:R. David Gustafson, Jeff HughesPublisher:Cengage Learning