
Videos
In each of Exercises C.168–C.I74, determine whether the number of observations is large enough to use Friedman 's test as given in Procedure C.6 on page C-102. If the number of observations is large enough, apply that procedure to perform a Friedman test at the 5% significance level using either the critical-value approach or the P-value approach.
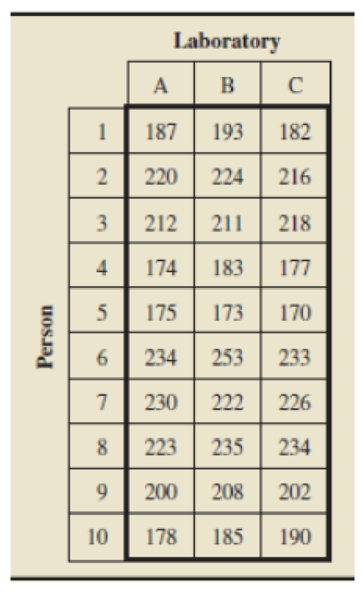
C.168 Cholesterol Testing. A large health care organization uses three laboratories for the routine analysis of blood samples. It is important that the three labs provide equivalent lest results. To check that, blood samples are obtained from 10 randomly selected individuals; each blood sample is then divided into three blood subsamples of equal volume; and then the three blood subsamples from each person are sent to different labs, For this problem, the analysis is confined to assessing the measurement of the total cholesterol level for a person. The data are in the following table.
Want to see the full answer?
Check out a sample textbook solution
Chapter C Solutions
Introductory Statistics (10th Edition)


- Jensen Tire & Auto is in the process of deciding whether to purchase a maintenance contract for its new computer wheel alignment and balancing machine. Managers feel that maintenance expense should be related to usage, and they collected the following information on weekly usage (hours) and annual maintenance expense (in hundreds of dollars). Weekly Usage(hours) AnnualMaintenanceExpense 13 17.0 10 22.0 20 30.0 28 37.0 32 47.0 17 30.5 24 32.5 31 39.0 40 51.5 38 40.0 test statistic is 6.90 Find the p-value. (Round your answer to three decimal places.) p-value = State your conclusion. Reject H0. We conclude that the relationship between weekly usage (hours) and annual maintenance expense (in hundreds of dollars) is significant. Do not reject H0. We conclude that the relationship between weekly usage (hours) and annual maintenance expense (in hundreds of dollars) is significant. Reject H0. We cannot conclude that the relationship between weekly usage…arrow_forwardThe 2006 Statistical Abstract of the United States reports on a survey that asked a national sample of 80,000 American households about pet ownership. Suppose (for now) that one-third of all American households own a pet cat. Still supposing that one-third of all American households own a pet cat, between what two values do you expect 95% of all sample proportions to fall?arrow_forwardIf the proportion of the population in City A that is over 65 years old is p1 and the proportion of the population in City B that is over 65 years old is p2, what is the null hypothesis for a test to determine if the proportion of the population that is over 65 years old is greater in City A? Select the correct answer below: H0: p1−p2=0 H0: p1−p2>0 H0: p1−p2<0 H0: p1−p2≠0arrow_forward
- Back in April and May of 1985, the Gallup organization conducted a poll to estimate the percentage of Americans who approved of how President Reagan was handling his job. At the 5% significance level, do the data suggest that the percentage of those who approved of Reagan increased from April to May in 1985? Population 1: April p = 795/1528 = 0.5203 Population 2: May p = 840/1528 = 0.5497 Show all your steps, setting up your null and alternative hypothesis.arrow_forwardThe table below summarizes data from a survey of a sample of women. Using a 0.01 significance level, and assuming that the sample sizes of 800 men and 300 women are predetermined, test the claim that the proportions of agree/disagree responses are the same for subjects interviewed by men and the subjects interviewed by women. Does it appear that the gender of the interviewer affected the responses of women? Gender of Interviewer Man Woman Women who agree 534 264 Women who disagree 266 36 B. Compute the test statistic. ____ C. Find the critical value(s).___,_____ c2. What is the conclusion based on the hypothesis test? (Fail to reject/ Reject) H0. There (is/is not) sufficient evidence to warrant rejection of the claim that the proportions of agree/disagree responses are the same for subjects interviewed by men and the subjects interviewed by women. It…arrow_forwardUse the method of hypothesis testing to determine if Ryan should conclude his saplings are growing. Take a 5% significance level.arrow_forward
- Answer the following questions A- B- what is the sensitivity of the screening test? C- what is the specificity of te screening test? D- How likely is it that person with epilepsy has depression if they screened positive for it? E- How likely is it that person with epilepsy does not have depression if they screened negative for it? F- what is the prevalence of clinician diagnosed depression among those with epilepsy in this study? G- what would happen to the positive predictive value of the prevalence of depression was significantly higher than what you calculated in part F?arrow_forwardThe better-selling candies are often high in calories. Assume that the following data show the calorie content from samples of M&M's, Kit Kat, and Milky Way candies. M&M's Kit Kat Milky Way 210 205 200 220 215 218 230 235 202 240 225 190 210 250 180 Test for significant differences among the calorie content of these three candies. State the null and alternative hypotheses. H0: MedianMM = MedianKK = MedianMWHa: MedianMM > MedianKK > MedianMW H0: All populations of calories are identical.Ha: Not all populations of calories are identical. H0: Not all populations of calories are identical.Ha: All populations of calories are identical. H0: MedianMM ≠ MedianKK ≠ MedianMWHa: MedianMM = MedianKK = MedianMW H0: MedianMM = MedianKK = MedianMWHa: MedianMM ≠ MedianKK ≠ MedianMW Find the value of the test statistic. (Round your answer to two decimal places.) =____ Find the p-value. (Round your answer to three decimal places.) p-value = _____ At a…arrow_forwardAn experiment was conducted to test whether students’ performance (above or below average) is independent of stress level as a result of pressure on time table for the term in Hwanhwan Senior High School. The table below gives a 3 × 2 contingency table of the sample.Above Average Average Below AverageTOTALStressed 135. 250 285 670Not stressed 150 157 107 414TOTAL. 285 407 392 1084With the help of chi-square test statistics X2= ∑(oi - eij)/eij, determine whether students’ performance for the selected term in the school is independent of their stress level experienced from the time table at a = 0.05.arrow_forward
 Glencoe Algebra 1, Student Edition, 9780079039897...AlgebraISBN:9780079039897Author:CarterPublisher:McGraw Hill