
Introductory Statistics (10th Edition)
10th Edition
ISBN: 9780321989178
Author: Neil A. Weiss
Publisher: PEARSON
expand_more
expand_more
format_list_bulleted
Videos
Textbook Question
Chapter C.1, Problem 13E
In each of Exercises C.11–C.17 identify the following:
- a. the response, variable
- b. the factors
- c. the levels of each factor
- d. the number of treatment combinations
- e. the experimental units
- f. the number of observations for each treatment combination
- g. the experimental factors, if any
- h. the classification factors, if any
- i. whether the study is a designed experiment or an observational study
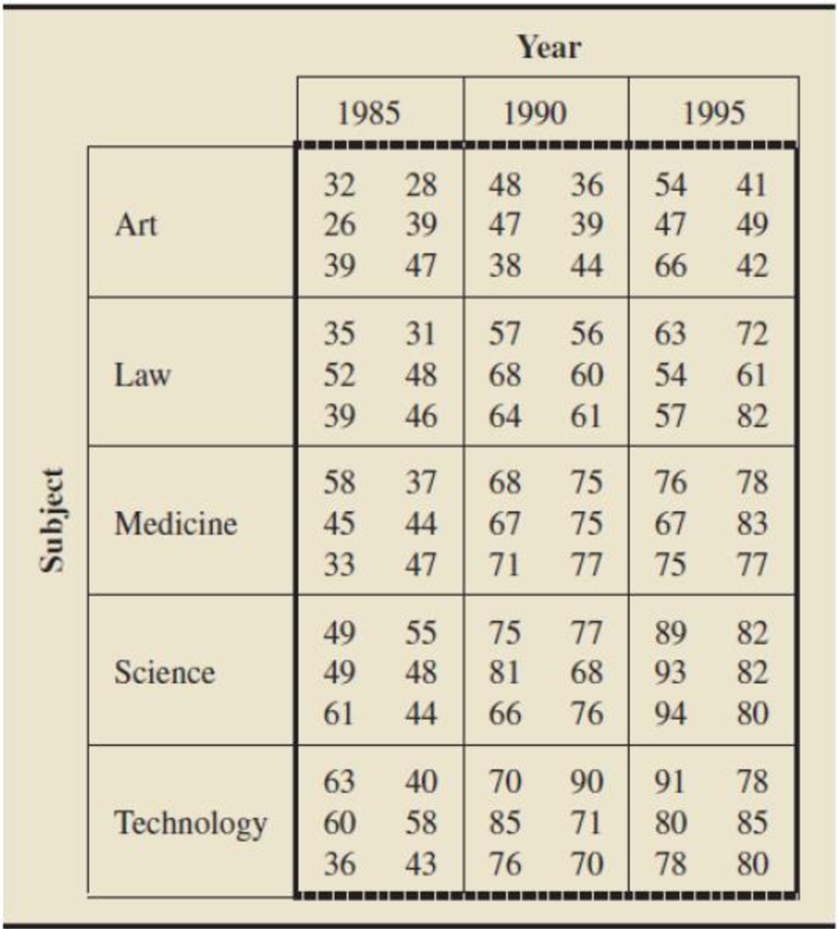
C.13 Book Prices. The R.R. Bowker Company collects data on retail prices of books and periodicals. Information about book prices is published in Publishers Weekly and in Bowker Annual: Library and Book Trade Almanac. Independent random samples were taken to compare retail book prices for five subjects (art, law, medicine, science, and technology) and three years (1985, 1990, and 1995). The table below displays the data, in dollars.
Expert Solution & Answer
Want to see the full answer?
Check out a sample textbook solution
Students have asked these similar questions
Identify each of the following designs as being an observational study or an experiment. If the study is an observational study, state whether is retrospective or prospective. If the study is an experiment, identify the explanatory and response variables.
1. A researcher wants to test the effectiveness of a new pill that lowers blood pressure. The researcher gives the pill to half the patients who have volunteered for the study, and gives a placebo pill to the other half. The blood pressure of each group is measured at the end of the study to assess the effectiveness of the new drug.
Define each of the following terms in the context of experimental design.
a. Response variable
b. Factor
c. Levels
d. Treatments
In order to determine whether a particular medication was effective in curing the common cold, one group of patients was given the medication, while another group received sugar pills. The results of the study are shown below.
PatientsCured
PatientsNot Cured
Received medication
70
10
Received sugar pills
20
50
We are interested in determining whether the medication was effective in curing the common cold.
Chapter C Solutions
Introductory Statistics (10th Edition)
Ch. C.1 - Define the following terms: a. factor b. levels of...Ch. C.1 - A three-way factorial design has Factor A at 3...Ch. C.1 - A four-way factorial design has Factor A at 2...Ch. C.1 - A three-way factorial design has Factor A at 6...Ch. C.1 - Answer true or false to each of the following...Ch. C.1 - Prob. 8ECh. C.1 - Answer true or false to each of the following...Ch. C.1 - Prob. 10ECh. C.1 - In each of Exercises C.11C.17 identify the...Ch. C.1 - In each of Exercises C.11C.17 identify the...
Ch. C.1 - In each of Exercises C.11C.17 identify the...Ch. C.1 - In each of Exercises C.11C.17 identify the...Ch. C.1 - In each of Exercises C.11C.17 identify the...Ch. C.1 - Prob. 16ECh. C.1 - In each of Exercises C.11C.17 identify the...Ch. C.2 - Consider a 3 4 ANOVA. a. Identify the number of...Ch. C.2 - Consider a 4 2 ANOVA. a. Identify the number of...Ch. C.2 - Prob. 25ECh. C.2 - Prob. 26ECh. C.2 - Prob. 27ECh. C.2 - Prob. 28ECh. C.2 - In two-way ANOVA, identify what we mean by a. a...Ch. C.2 - In two-way ANOVA, what does it mean we have...Ch. C.2 - In Exercises C.31C.33, we have presented partially...Ch. C.2 - Prob. 32ECh. C.2 - Prob. 33ECh. C.2 - Prob. 34ECh. C.2 - State the null and alternative hypotheses for a...Ch. C.2 - Prob. 36ECh. C.2 - In a two-way ANOVA, why is the test for...Ch. C.2 - Prob. 38ECh. C.2 - Prob. 39ECh. C.2 - Prob. 40ECh. C.2 - Prob. 41ECh. C.2 - Referring to Exercise C.38, for which part(s) is...Ch. C.2 - Prob. 43ECh. C.2 - Prob. 44ECh. C.2 - Prob. 45ECh. C.2 - Prob. 46ECh. C.3 - In each of Exercises C.47C.53, we have presented a...Ch. C.3 - In each of Exercises C.47C.53, we have presented a...Ch. C.3 - Prob. 49ECh. C.3 - Prob. 50ECh. C.3 - Prob. 51ECh. C.3 - Prob. 52ECh. C.3 - Prob. 53ECh. C.3 - Prob. 54ECh. C.3 - Prob. 55ECh. C.3 - Prob. 56ECh. C.3 - Prob. 57ECh. C.3 - Prob. 58ECh. C.3 - Prob. 59ECh. C.3 - Prob. 60ECh. C.3 - Prob. 61ECh. C.3 - Prob. 62ECh. C.3 - Prob. 63ECh. C.3 - Prob. 64ECh. C.3 - Prob. 65ECh. C.3 - Prob. 66ECh. C.3 - Prob. 67ECh. C.3 - Prob. 68ECh. C.3 - Prob. 69ECh. C.3 - Prob. 70ECh. C.3 - Prob. 71ECh. C.4 - In an experiment with two factors, A and B, what...Ch. C.4 - If the confidence interval for the difference...Ch. C.4 - Prob. 74ECh. C.4 - Prob. 75ECh. C.4 - Let Factor A have three levels and Factor B have...Ch. C.4 - In Exercises C.77C.83, we have repeated the...Ch. C.4 - Prob. 78ECh. C.4 - In Exercises C.77C.83, we have repeated the...Ch. C.4 - Prob. 80ECh. C.4 - In Exercises C. 77-C.83. we have repeated the...Ch. C.4 - In Exercises C.77C.83, we have repeated the...Ch. C.4 - Prob. 83ECh. C.4 - Household Income. Refer to Exercise C.77. Use the...Ch. C.4 - Prob. 85ECh. C.4 - Prob. 86ECh. C.4 - Highway Signs. Refer to Exercise C.80. Use the...Ch. C.4 - Hospital Stays. Refer to Exercise C.81. Use the...Ch. C.4 - Prob. 89ECh. C.4 - Advertising and Sales. Refer to Exercise C.83. Use...Ch. C.5 - In each of Exercises C.91C.97, identify the...Ch. C.5 - Prob. 92ECh. C.5 - In each of Exercises C.91C.97, identify the...Ch. C.5 - In each of Exercises C.91C.97, identify the...Ch. C.5 - In each of Exercises C.91C.97, identify the...Ch. C.5 - In each of Exercises C.91C.97, identify the...Ch. C.5 - In each of Exercises C.91C.97, identify the...Ch. C.6 - What is the purpose of blocking in a randomized...Ch. C.6 - Prob. 104ECh. C.6 - Prob. 105ECh. C.6 - Prob. 106ECh. C.6 - Answer true or false to the following statements...Ch. C.6 - Prob. 108ECh. C.6 - In randomized block ANOVA, what is meant when we...Ch. C.6 - Prob. 110ECh. C.6 - State the null and alternative hypotheses for a...Ch. C.6 - Identify, give the degrees of freedom for, and...Ch. C.6 - Prob. 113ECh. C.6 - Prob. 114ECh. C.6 - Prob. 115ECh. C.6 - Prob. 116ECh. C.6 - Prob. 117ECh. C.6 - Prob. 118ECh. C.7 - In each of Exercises C.119C.125, we have presented...Ch. C.7 - Prob. 120ECh. C.7 - Prob. 121ECh. C.7 - Prob. 122ECh. C.7 - Prob. 123ECh. C.7 - Prob. 124ECh. C.7 - Prob. 125ECh. C.7 - Prob. 126ECh. C.7 - Prob. 127ECh. C.7 - Prob. 128ECh. C.7 - Prob. 129ECh. C.7 - Prob. 130ECh. C.7 - Prob. 131ECh. C.7 - Penicillin Yields. Refer to Exercise C.121. Use...Ch. C.7 - Prob. 133ECh. C.7 - Battery Lifetimes. Refer to Exercise C.123. Use...Ch. C.7 - Prob. 135ECh. C.7 - Prob. 136ECh. C.7 - Prob. 137ECh. C.7 - Prob. 138ECh. C.7 - Prob. 139ECh. C.7 - Prob. 140ECh. C.7 - Prob. 141ECh. C.7 - Golf Ball Driving Distances. Refer to Exercise...Ch. C.7 - Prob. 143ECh. C.7 - Analgesic Effectiveness. Refer to the analgesic...Ch. C.8 - In a randomized block experiment with treatment...Ch. C.8 - If the confidence interval for the difference...Ch. C.8 - The parameter v for the q-curve in a Tukey...Ch. C.8 - Prob. 148ECh. C.8 - Prob. 149ECh. C.8 - Prob. 150ECh. C.8 - Prob. 151ECh. C.8 - Prob. 152ECh. C.8 - Prob. 153ECh. C.8 - Prob. 154ECh. C.8 - Mileage for Gasoline Brands. Refer to Exercises...Ch. C.8 - Prob. 156ECh. C.8 - Prob. 157ECh. C.8 - Barley Variety Yields. Refer to Exercises C.125...Ch. C.8 - Prob. 159ECh. C.9 - Of which test is the Friedman test a nonparametric...Ch. C.9 - Prob. 161ECh. C.9 - Prob. 162ECh. C.9 - Prob. 163ECh. C.9 - Fill in the following blank: If the null...Ch. C.9 - Prob. 165ECh. C.9 - For a Friedman test to compare the means of six...Ch. C.9 - Prob. 167ECh. C.9 - In each of Exercises C.168C.I74, determine whether...Ch. C.9 - Prob. 169ECh. C.9 - Prob. 170ECh. C.9 - Prob. 171ECh. C.9 - Prob. 172ECh. C.9 - Prob. 173ECh. C.9 - Prob. 174ECh. C.9 - Prob. 175ECh. C.9 - Prob. 176ECh. C.9 - Prob. 177ECh. C.9 - Prob. 178ECh. C.9 - Prob. 179ECh. C.9 - Prob. 180ECh. C.9 - Prob. 181ECh. C - Discuss the differences between a designed...Ch. C - In a complete factorial design, how do you...Ch. C - Prob. 3RPCh. C - Prob. 4RPCh. C - Prob. 5RPCh. C - Prob. 6RPCh. C - Prob. 7RPCh. C - For a two-way ANOVA: a. List and interpret the...Ch. C - Prob. 9RPCh. C - Prob. 10RPCh. C - State the assumptions for a two-way ANOVA and...Ch. C - Prob. 12RPCh. C - Prob. 13RPCh. C - Prob. 14RPCh. C - This problem concerns multiple comparisons. a....Ch. C - Cereal Sales. Refer to Problem 13. Perform...Ch. C - Explain why it is sometimes preferable to employ a...Ch. C - For a randomized block ANOVA: a. List and...Ch. C - Prob. 19RPCh. C - Prob. 20RPCh. C - Prob. 21RPCh. C - Prob. 22RPCh. C - Prob. 23RPCh. C - Prob. 24RPCh. C - Prob. 25RPCh. C - Identify the nonparametric alternative to the...Ch. C - Explain the logic behind the Friedman test.Ch. C - Prob. 28RPCh. C - Prob. 29RPCh. C - Prob. 30RPCh. C - Prob. 31RPCh. C - Prob. 32RPCh. C - Prob. 33RPCh. C - Prob. 34RPCh. C - Prob. 35RPCh. C - Prob. 36RP
Knowledge Booster


Learn more about
Need a deep-dive on the concept behind this application? Look no further. Learn more about this topic, statistics and related others by exploring similar questions and additional content below.Similar questions
- A researcher wishes to study the relationship between education and income separately for individuals who have college degrees, and for those who don't. To this end, he interviews 100 individuals in each category. Survey results are listed in the table below. non college graduates college graduates avg education 13 yr 18 yr std. dev. education 2 yr 1.2 yr Sxx 396 yr2 143 yr2 Avg. Income $67,200 $84,950 std. dev. income $9,400 $10,500 correlation coefficient .25 .15 a. Use the data above to find point estimates for regression coefficients B0NG and B1NG for non-college graduates and BoG and B1G for college graduates. b. Propose an unbiased estimator for the difference theta=B1G - B1NG in slope coefficients for the two sub-populations, and show that B(theta hat)= 0. c. Assume that the error terms ENG and EG for non-graduates and graduates, respectively, are both distributed normally, with known standard deviation oENG = oEG = $ 10,000. In that case, determine the…arrow_forwardA small firm negotiates an annual pay rise with each of its twelve employees. In an attempt to simplify the process, it is proposed that each employee should be given a score, x, based on his/her level of responsibility. The following table gives last year’s salaries and proposed scores. Employee Score, x Annual salary, y Employee Score, x Annual salary, y A 10 5750 G 85 18800 B 55 17300 H 64 14850 C 46 14750 I 36 9900 D 27 8200 J 40 11000 E 17 6350 K 30 9150 F 12 6150 L 37 10400 A. Find a suitable linear regression equation ? = ? + ??. (2marrow_forwardThe director of student services at San Bernardino Valley College is interested in whether women are just as likely to attend orientation as men before they begin their coursework. A random sample of freshmen at San Bernardino Valley College were asked to specify their gender and whether they attended the orientation. The results of the survey are shown below: Data for Gender vs. Orientation Attendance Women Men Yes 422 529 No 267 268 Let p1 be the proportion of women who attended the orientation and p2p2 be the proportion of men who attended the orientation. What can be concluded at the α = 0.10 level of significance? For this study, what sampling distribution should be used? Select an answer Chi-Square distribution uniform distribution standard normal distribution binomial distribution Student t distribution The null and alternative hypotheses would be: H0:H0: Select an answer μ μ1-μ2 p1-p2 μd p Select an answer ≠ < > = (please enter a decimal)…arrow_forward
arrow_back_ios
arrow_forward_ios
Recommended textbooks for you
 MATLAB: An Introduction with ApplicationsStatisticsISBN:9781119256830Author:Amos GilatPublisher:John Wiley & Sons Inc
 Probability and Statistics for Engineering and th...StatisticsISBN:9781305251809Author:Jay L. DevorePublisher:Cengage Learning
 Statistics for The Behavioral Sciences (MindTap C...StatisticsISBN:9781305504912Author:Frederick J Gravetter, Larry B. WallnauPublisher:Cengage Learning
 Elementary Statistics: Picturing the World (7th E...StatisticsISBN:9780134683416Author:Ron Larson, Betsy FarberPublisher:PEARSON
 The Basic Practice of StatisticsStatisticsISBN:9781319042578Author:David S. Moore, William I. Notz, Michael A. FlignerPublisher:W. H. Freeman
 Introduction to the Practice of StatisticsStatisticsISBN:9781319013387Author:David S. Moore, George P. McCabe, Bruce A. CraigPublisher:W. H. Freeman
MATLAB: An Introduction with Applications
Statistics
ISBN:9781119256830
Author:Amos Gilat
Publisher:John Wiley & Sons Inc
Probability and Statistics for Engineering and th...
Statistics
ISBN:9781305251809
Author:Jay L. Devore
Publisher:Cengage Learning
Statistics for The Behavioral Sciences (MindTap C...
Statistics
ISBN:9781305504912
Author:Frederick J Gravetter, Larry B. Wallnau
Publisher:Cengage Learning
Elementary Statistics: Picturing the World (7th E...
Statistics
ISBN:9780134683416
Author:Ron Larson, Betsy Farber
Publisher:PEARSON
The Basic Practice of Statistics
Statistics
ISBN:9781319042578
Author:David S. Moore, William I. Notz, Michael A. Fligner
Publisher:W. H. Freeman
Introduction to the Practice of Statistics
Statistics
ISBN:9781319013387
Author:David S. Moore, George P. McCabe, Bruce A. Craig
Publisher:W. H. Freeman
what is Research Design, Research Design Types, and Research Design Methods; Author: Educational Hub;https://www.youtube.com/watch?v=LpmGSioXxdo;License: Standard YouTube License, CC-BY