Concept explainers
Videos
To explain: What tells the data shown by the given scatter plot and the given
Answer to Problem 4.5.1P
The given scatter plot shows the
Explanation of Solution
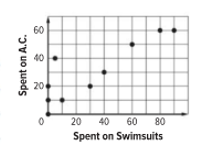
Given information: The data given scatter plot is:
The
Calculation:
The given scatter plot shows the positive correlation between the average monthly amount spent on swimsuits and the average monthly amount spent on air conditioning.
The correlation coefficient for the data is
Chapter ISG Solutions
Algebra 1, Homework Practice Workbook (MERRILL ALGEBRA 1)
Additional Math Textbook Solutions
College Algebra
College Algebra (7th Edition)
Linear Algebra and Its Applications (5th Edition)
Calculus: Early Transcendentals (2nd Edition)


 Algebra and Trigonometry (6th Edition)AlgebraISBN:9780134463216Author:Robert F. BlitzerPublisher:PEARSON
 Contemporary Abstract AlgebraAlgebraISBN:9781305657960Author:Joseph GallianPublisher:Cengage Learning
 Linear Algebra: A Modern IntroductionAlgebraISBN:9781285463247Author:David PoolePublisher:Cengage Learning
 Algebra And Trigonometry (11th Edition)AlgebraISBN:9780135163078Author:Michael SullivanPublisher:PEARSON
 Introduction to Linear Algebra, Fifth EditionAlgebraISBN:9780980232776Author:Gilbert StrangPublisher:Wellesley-Cambridge Press
 College Algebra (Collegiate Math)AlgebraISBN:9780077836344Author:Julie Miller, Donna GerkenPublisher:McGraw-Hill Education